Urbanization
and Empire Formation Project
Institute
for Research on World-Systems
University
of California, Riverside
5-31-02
(3825 words)
http://irows.ucr.edu/research/citemp/estcit/estcit.htm
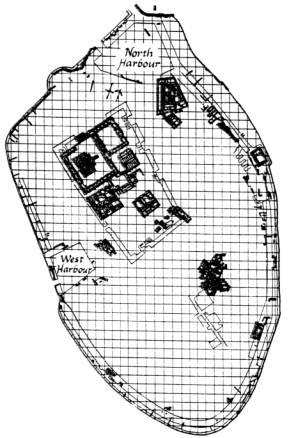
City
Plan of Ur
The
accuracy of estimating the total number of residents for an urban area
remains highly questionable and problematic.Many
historians, archaeologists, sociologists, and even economists have tried
various means of estimating populations by using standard multipliers and
complex formulas for making inferences from historical records. Even differences
in the physical size of a settlement, amount of area devoted to housing,
the number of stories per house, or even the issue of what constitutes
the extent of an urban area remain highly debated issues. These questions
continue today with modern cities. Does the city of Los Angeles, which
has no defensive wall to surround the original city, stop at an invisible
jurisdictional city or county line? Or does the city represent the area
of continuous built-up settlement that stretches along the coast of Southern
California into Mexico?
Cities
are the living creations of people and societies that are in a constant
state of flux as people move into and out of the city. Historical fluctuations
of a city population would have occurred on a daily basis as merchants,
farmers, and many others moved through the city. Major population changes
would have occurred between seasons, during times of war or plague, or
other significant events of the time.
The
physical sizes of settlements are expressed as acres, hectares, square
meters, square feet, and many other measures depending upon the region
and culture of the estimators. Table 1 is a conversion table for some of
the more common ways settlement areas are estimated.
|
|
Hectare
|
Acre
|
Square
Meters
|
Square
Feet
|
|
Hectare
|
|
|
|
|
|
Acre
|
|
|
|
|
Table 1:
Area Measurement Unit Conversions
The
original data used by our Urbanization and Empire Formation Project were
from Four Thousand Years of Urban Growth by Tertius Chandler (1987).Chandler
tried to systematically estimate the city populations of all major cities
in urban history. His endeavor encountered many problems and suffered from
limited information from text sources as well as incomplete archaeological
data. While certainly the most complete effort of its time, there have
been many criticisms of some of his estimates.Chandlers
definition of a city is the urban area including suburbs lying outside
the municipal area, but he specifically claims that there were no suburbs
outside city walls and that there was no large suburb growth until 1850
CE (Chandler 6). This obviously causes immediate problems since the presence
of suburbs has been well documented in history with new walls built to
enclose a population that had spread beyond the original walls.
Tertius
Chandler's (1987) compendium contains population estimates for the largest
cities on Earth since the beginnings of urbanization in Mesopotamia. Chandler's
data set is a valuable resource based on decades of research at the library
of the University of California at Berkeley. For our purposes, however,
it needs to be upgraded using more recently published studies than Chandler
used and extended to cover more frequent time points and better coverage
of South Asian cities. The time points used by Chandler are too far apart
before 1100 CE (e.g. 1200 BCE, 650 BCE, 430 BCE, 200 BCE, etc.). We propose
to upgrade and extend Chandler's data set by:
·Extending
the data set to include more South Asian cities and assembling data on
East, Central and West Asian/Mediterranean cities for more frequent temporal
estimates[1],
and
·Adding
new estimations based on recent studies that have come out since Chandler
completed his published data set. [2]
For
this job of city size data enhancement and expansion we will improve upon
the methods that Chandler employed (Chandler 1987: 2-13). Chandler used
several methods for estimating the population sizes of cities -- census
figures, travelers reports, size of the urban built up area, hearth counts,
size of the residential area, the size of the military, etc.Chandler
developed the art of the multiplier, a method for converting estimates
of population density in urban areas into estimates of the total urban
population. These methods have been advanced especially by anthropologists
who have done cross-cultural studies of human settlements (e.g. Brown 1987).
We will employ the more recently developed insights regarding the estimation
of population densities and the use of multipliers to estimate total urban
population sizes.
Measurement
of the population sizes of cities is not without difficulties, especially
for early periods. How can we know the number of people who reside in Los
Angeles today? We use the most recent census, a survey ofresidents
conducted by the U.S. federal government. What are the spatial boundaries
of Los Angeles? Do we mean the city of Los Angeles, Los Angeles County,
the contiguous built-up area that constitutes greater Los Angeles, or
a definition based on the proportion of the local population that is employed
in Los Angeles? Does Los Angeles include San Diego? Nighttime satellite
photos of city lights reveal a single unbroken gigalopolis from Santa Barbara
to Tijuana:  So
where is Los Angeles? We want to use the contiguous built-up area
as our main way of spatially defining cities. For early cities we do not
have official, and ostensibly complete, census figures. Thus we rely on
methods that archaeologists and students of early urbanization have developed
to estimate the population sizes of cities.
So
where is Los Angeles? We want to use the contiguous built-up area
as our main way of spatially defining cities. For early cities we do not
have official, and ostensibly complete, census figures. Thus we rely on
methods that archaeologists and students of early urbanization have developed
to estimate the population sizes of cities.
These
involve, for example, determining the spatial size of the city and then
estimating the population density per unit of area and so estimating the
total population. Population density varies depending upon the size of
families, the nature of dwellings, the amount of non-residential area within
settlements, and cultural differences. Anthropologists and archaeologists
have made an important effort to produce reliable methods for estimating
population sizes from residential areas (Brown 1987).
Tertius
Chandler (1987) used reports about the number of soldiers to estimate city
sizes, assuming that an army of men represents, on the average, about one-sixth
(Chandler 8) of the population of the city in which the army resides. Such
estimates are obviously error-prone.
Another
problem with existing estimates of city sizes is that they were produced
from surveys of both secondary and primary sources that are now, in many
cases, obsolete because archaeologists, epigraphers and historians such
as Kenoyer and Bahn have published more recent and better research. Chandlers
compendium was mainly based on his thorough survey of the contents of the
main library at the University of California, Berkeley over the four decades
prior to its publication in 1987.
Chandler
also used proportions of city population in districts at other time points
to estimate back.Examples are the
estimated city populations of Kaifeng in 1642 and Hangchow in 1862 with
their proportions in 1930.Chandler
also used comparisons by travelers to other cities such as Alexandria to
Cologne in 1500. His estimation of number of people per hectare has a range
of 75 to 200 with a standard of 100 people per hectare. This average comes
from what Chandler terms Foxs Law. This states that, the density ratio
for an old wall should be substantially higher than for a new one (Chandler
6). So the area of a new wall had an average of 75 persons per hectare
while an older wall may have an average of 200 persons per hectare. Cities,
such as Genoa and Edinburgh, could reach as high as 500 persons per hectare
because mountains preventing expansion boxed them in. Therefore an average
of 100 persons per hectare is reached between the varying densities of
walled areas in older cities. Chandler also considers Chinese cities to
have an exceptionally low density of 75 persons per hectare, because of
the Chinese refusal to sleep below anyone (Chandler 7).
A
major endeavor to improve upon Chandlers data was undertaken by Paul Bairoch(19xx,
19xx).Bairoch considered three factors
when estimating city populations.
1)The
amount of ground within the city walls occupied by residential buildings
versus non-residential buildings, gardens or grazing areas.
2)The
amount of uninhabitable space within buildings or multiple stories
3)The
density of occupations that, Bairoch states, may vary considerably.
Bairoch
started with the Chandler and Fox data from Three Thousand Years of
Urban Growth[3]and
revised and updated from more recent, or possibly overlooked, sources.He
estimated increasing the European City data sets by 15% and the Latin American
data sets by as much as 50%.
Bairoch
reports that many scholars have used population densities of 400-700 people
per hectare. He considers these estimates to be high. Bairochs population
density estimates vary based on civilization and time period and he includes
an estimate of the margin of error for each group (see Table 2).
REGION
|
|
|
|
Cities
of Antiquity
|
150
|
20-25%
|
|
Cities
of Islam
|
250
|
20-25%
|
|
Cities
of Europe
(Greek
and Roman)
|
100-115
|
20%
|
|
(1300-1500)
|
100-115
|
10%
|
|
(1550-1800)
|
175-190
|
|
Table 2:
Bairoch's Urban Population Density Estimates
In Table 3 below the
differences between Bairoch and Chandlers estimates of city populations
are compared. For Paris they are fairly similar but with four major differences
at the 1300, 1500, 1600, and 1850 time points. In 1850 there is a difference
of almost 300,000 people and the 1300 time point has a 34% difference in
the estimates. At all four time points there is a difference of more than
15% between the populations. When comparing data sets for Rome there is
only one time point, in 1500, that has a difference of more than 10% with
only minor variations in estimates between the two for other time points.
Paris
|
|
|
900
|
1000
|
|
|
|
|
|
|
|
|
|
|
Chandler
|
25
|
----
|
20
|
110
|
228
|
280
|
185
|
245
|
530
|
556
|
547
|
1314
|
|
Bairoch
|
25
|
----
|
20
|
110
|
150
|
275
|
225
|
300
|
500
|
570
|
550
|
1053
|
Rome
|
|
|
900
|
1000
|
|
|
|
|
|
|
|
|
|
|
Chandler
|
50
|
40
|
35
|
35
|
30
|
33
|
38
|
102
|
138
|
146
|
142
|
158
|
|
Bairoch
|
50
|
40
|
35
|
35
|
30
|
33
|
55
|
100
|
135
|
158
|
153
|
175
|
* Time
points (at 1300, 1500, 1600 for Paris and 1500 for Rome) show differences
of more than 10%.
Table 3:
Chander and Bairoch City Population Size Estimates
Fekri
A. Hassan, in Demographic Archaeology also uses a standard of 100
people per hectare when estimating most urban population centers. Others
have used similar methods to determine population sizes. Robert M. Adams
(1965) used an average of 200 persons per hectare to estimate the populations
of ancient Mesopotamian cities. He reached this figure by studying the
modern cities in the area, specifically the old quarters of Baghdad (216
persons/ha) and many towns and villages on the Susiana Plain (223 persons/ha)
and Kur Basin (137persons/ha). Braidwood and Reed (1957) took the size
of the present population of the mound of Erbil to arrive at an estimate
of 213 persons per acre (19 meters squared per person) of town area (Hassan
66). Frankfort (1950) studied the sizes of houses in the Middle East to
reach an estimate of 297-494 persons/ha and Colin Renfrew estimated theurban
populations of the Aegean in the Late Bronze Age at 300 persons/ha and
200 persons/ha for the Neolithic period.
Hassan
summarizes a long effort by anthropologists to determine the population
densities of villages and towns. These methods examine the area within
built structures devoted to dwelling floor space and the average number
of people per residential structure.Archaeologists
can often count the number of hearths in a settlement, and so they know
the number of households. The effort here is to estimate the average number
of people in a household. These methods are quite relevant for estimating
the population sizes of cities because the number of residential units
can be determined from complete excavations, or estimated from partial
excavations. And travelers reports often mention estimates of the number
of households in cities.
|
|
|
|
|
||
|
|
|
|
|
|
|
|
3300BCE
|
Uruk
|
200
(Bahn)
|
20000
|
30000
|
20000
|
|
2800BCE
|
Uruk
|
550
(Bahn)
|
55000
|
82500
|
40000*
|
|
|
|
|
|
|
|
|
2100BCE
|
Rakhigarhi
|
80(K)
|
8000
|
12000
|
8000
|
|
|
Harappa
|
150(K)
|
15000
|
22500
|
15000
|
|
|
Mohenjo-Daro
|
250(K)
|
20000*
|
37500
|
25000
|
|
|
Ganweriwala
|
80(K)
|
8000
|
12000
|
8000
|
|
|
Dholavira
|
100(K)
|
10000
|
15000
|
10000
|
|
|
|
|
|
|
|
|
1600BCE
|
Avaris
|
1000(C)
|
100000
|
150000
|
100000
|
|
|
|
|
|
|
|
|
1200BCE
|
Tyre
|
~70
(Ba)
|
7000
|
30000*
|
7000
|
|
|
|
|
|
|
|
|
1360BCE
|
Chengchow
|
320
(C)
|
32000
|
48000
|
32000
|
|
1360BCE
|
Erech
|
450
(C)
|
50000*
|
67500
|
45000
|
|
|
|
|
|
|
|
*These
estimates were already calculated and published. The other numbers have
been calculated using the different assumptions of the authors and the
areal sizes listed.
Table 4:
Estimates of City Populations Produced by Different Assumptions About Population
Density
Sources: Bahn (1999), K= Kenoyer (1998), C= Chandler (1987), Ba=Bairoch (1988).
One alternative method is to create a mathematical relationship between population size and the size of the urban area. This can be done using the total dwelling floor area of a settlement to create an allometric growth formula and determine the population of the settlement. The general formula for an allometric relationship is Y=aXb where Y is the dwelling floor area, X is the population size, and a and b are constants. This can be manipulated as a linear relationship too logY = loga+ b logX where the constants, a and b, can substituted in the allometric equation since b is the antilog of log a.
Norbeck(1971) and Naroll(1962) both created their own relationships for estimating population sizes using allometric growth patterns to estimate population sizes of settlements. Norbecks use of allometric growth was a pattern of growth where the area required as individuals are added to the population is not constant(Hassan 69). His formula is A=aP(2/3) where he compares an urban area to the cross-section of a volcano. In this model the population density is low at the edge or rural areas, increases rapidly in a suburban area into the city, and decreases again near the center of the city where residences are not common.
Naroll studied data from 18 different societies to estimate the prehistoric population of sites. Naroll believes that allometric growth is a phenomenon that is associated with urbanization (Brown 8) using a formula of A=21.7P(.84195) to explain changes in urban area as population increases. This was then simplified to P=(A/10meters squared) where each person required 10 square meters of habitable space. LeBlanc attacked this method of estimating populations in 1971. He showed that the standard deviation of floor space within family areas was quite large, undermining the reliability of determining population size from floor area (Hassan 73).
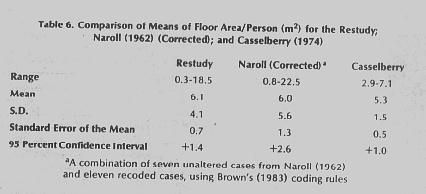
An attempt to expand and update Narolls work was done by Brown in 1987. Like Naroll, Brown studies the dwelling floor area of habitations to estimate the population sizes of settlements. He defines dwelling floor area as the area under the roof of a dwelling for the members of a household in square meters. Brown first attempts to use an allometric and regressional growth patterns to explain population with scattergram models. He finds a gourd-shaped distribution model fits the distribution best but finds no linear or allometric pattern at the lower end of the model and a moderately strong linear correlation at the upper end. Therefore he rejects the regression and correlational models as being unreliable and favors the use of mean of meters square per person for its practical aspects. Using a 95% confidence interval constructed from the standard area of the study he determines a population mean of between 4.7 and 7.5 m2/person with an average of 6.1 m2/person.
Table
5
was computed using data provided about the structural remains of Banawali,
a Harappan settlement along the Sarasvati River, using the different assumptions
about population means for the floor dwelling area made by Brown, Naroll,
and Casselberry. The site area is estimated from archaeological data as
300m x 150m to reach a total site area of 45,000m2 where 70%
of the site is estimated to have been occupied by homes making the total
dwelling area of the settlement as 31,500 squared meters.
City |
Est. total dwelling area |
Estimated Population |
|||
|
|
|
|
|
|
|
|
Banawali
|
|
|
|
|
|
Table 5: Estimates of City Population Produced
from Dwelling Floor Area.
Sources: Bisht, R.S. (1984)
We
will do library and web searches for all the literature that was not available
to Chandler for his 1984 compilation. This will involve thorough investigation
of the resources accessible at our home university (UCR) and accessible
other libraries and interlibrary loan programs. We will also have access
to documentary and archaeological evidence on the sizes of East Asian cities
obtainable by our collaborator Dr. Wang Jun at the Beijing Institute of
GIS and Cartography. For the city sizes project the newly published six
volume History of Chinese Population will be a helpful source. As a final
step we will send either a Graduate Research Assistant or a Project Post-Doctoral
Research Assistant to the Library of Congress in Washington DC to acquire
data not already obtained.In addition
to library research our project will develop a specialized search engine
for the Internet to examine digital databases such as JSTOR for information
about city and empire sizes. And of course we will make full use of existing
comprehensive online spatial and spatio-temporal data resources such as
the Alexandria Digital Library and the Electronic Cultural Atlas Initiative.
We will also utilize the data products of the Urban Environmental Monitoring
program (UER 2001; Ramsey et al 1999) to study the global system
of large cities in recent decades with remote sensing data.
Our
Urbanization and Empire Formation Project will upgrade the city data sets
by improving upon Bairochs approach to estimating urban population densities
using the methods developed by demographers and anthropologists for estimating
household sizes.We will use the
most recent and complete information available to upgrade and expand the
accuracy and temporal resolution of city size estimations.
We
plan to utilize a measurement error model to estimate the population
sizes of cities from available estimates of the following indicators:
-
Built-up
Area of the Whole City
-
Residential
Area
-
Non-Residential
Area
-
Area
within the City Wall
-
Population
Density of the Whole City
-
Population
Density of the Residential Area
-
Number
of Dwellings
-
Average
number of Inhabitants per Dwelling
Each
datum will have the year or period of the estimate and the source of the
information associated with it in a relational database. Each city will
have the longitude and latitude of its central point and alternative names
associated with it.
With
this new and expanded dataset we hope to provide a better understanding
of the evolution of complex societies and the processes by which regional
interaction networks expanded to become the single global political economy
of today.
References
Bahn,
Paul G. 1997 Lost Cities: Discoveries in World Archeology: Welcome
Rain
Bairoch,
Paul 1988 Cities and Economic Development Chicago: University of
Chicago Press.
Barnes,
Ian and Hudson, Robert 1998 Historical Atlas of Asia: Simon and
Chester McMillan
Bisht,
R.S. 1984 Structural Remains and Town-planning of Banawali: Indian
Archaeological
Society
Brown,
Barton M. 1987 Population estimation from floor area, Behavior Science
Research
21:1-49.
Chandler,
Tertius 1987 Four Thousand Years of Urban Growth: The Edwin Mellen
Press
Chase-Dunn,
Christopher 1985a "The system of world cities: AD 800-1975" Pp. 269-292
in Michael Timberlake (ed.) Urbanization in the World Economy New
York: Academic Press.
Chase-Dunn,
Christopher. 1985b. "The coming of urban primacy in Latin America," Comparative
Urban Research XI, 1-2
Chase-Dunn,
Christopher 1992 "The role of cities in the transformation of world-systems"
Volker Bornschier and Peter Lengyel (eds.) World Society Studies,
Volume 2. Frankfurt and New York: Campus Verlag.
Chase-Dunn,
Christopher and Alice Willard 1993 "Systems of cities and world-systems:
settlement size hierarchies and cycles of political centralization, 2000
BC-1988 AD." A paper presented at the annual meeting of the International
Studies Association, Acapulco, March 24. http://www.jhu.edu:80/~soc/pcid/papers/17/pcidpap17.htm
Ember,
Melvin 1973 Archaeological indicator of matrilocal versus patrilocal residence,
American
Antiquity 38:177-182.
Fletcher,
Roland 1995 The Limits of Settlement Growth: A Theoretical Outline.
Cambridge:
Cambridge
University Press.
Hassan,
Fekri A. 1981 Demographic Archaeology. New York: Academic Press.
Kenoyer,
Jonathan Mark 1998 Ancient Cities of the Indus Civilization: Oxford
University Press
Skinner,
G. William (ed.) 1977 The City in Late Imperial China Stanford:
Stanford University Press.
Tobler,
Waldo and S. Wineburg 1971 A Cappadocian Speculation Nature 231,
May 7.
UER
2000 Global Urban Monitoring with ASTER. http://ivis.eps.pitt.edu/projects/UEM/
Wang
Jun 2001 GIS Database construction to the population in the Han Dynasties,
Science
of Surveying and Mapping 26(3), ISSN: 1009-2307
Woldenberg,
Michael J. 1971 Allometric Growth In Social Systems: Sixth Technical
Report
National
Science Foundation