Appendix
to "Trade Globalization since 1795: waves of
integration in the world-system"
American Sociological Review February
2000, Millennial Symposium.
Christopher Chase-Dunn
Yukio Kawano
Benjamin Brewer
Department of Sociology
Johns Hopkins University
Baltimore, MD. 21218 USA
chriscd@jhu.edu
v. 8-31-99
Table of Contents
Link to Data: tradglob.xls
Figure
A1: Number of Countries with Data on Openness, 1795-1995
Figure
A2: World Exports Per Capita in constant 1990 U.S. dollars.
Section
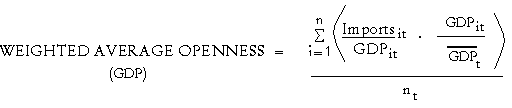
1: Weighting by GDP
Equation
3: Weighted Average Openness (GDP)
Figure
A3: Average Openness Trade Globalization Weighted by GDP compared with
Population Weighting
Section
2: Checking the New Measure of Trade Globalization
Figure
A4: World Totals and Average Openness Measures, 1950-1992
Figure
A5: Average Openness of Constant Groups of Countries (5 year moving
averages)
Table A1:
Pearsons r correlation coefficients of subgroup scores with our estimate
of world trade globalization that uses all data.
Figure
A6: Average Unweighted Openness Scores for Core , Periphery and Semiperiphery
Groups, 1908-1995
Table A2:
Country list showing categorization of Core, Peripheral and Semiperipheral
Countries
Table A3:
T-test of mean differences between Core and Periphery Average Openness
Scores (Unweighted), 1908-1995
Table A4:
T-test of mean differences between Core and Periphery Average Openness
Scores (Unweighted), 1908-1949
Figure
A7: Imports/GDP for the United States
Figure
A8: Average Openness for the U.S., Great Britain and France
Figure
A9: Average Openness for the Group of 7.
Figure
A10: Average Openness for the Group of 14.
Figure
A11: Average Openness for the group of 24.
Figure
A12: Core Country Shares of World GDP
Figure
A13: Trade and Investment Globalization
The number of countries for which we have data
on trade openness that were used to estimate world trade globalization
is graphed in Figure A1.
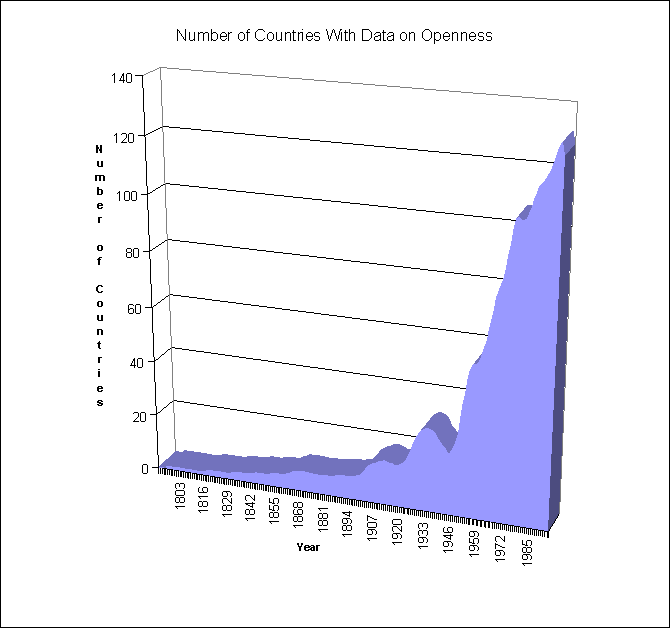
Figure A1: Number of Countries
with Data on Openness, 1795-1995
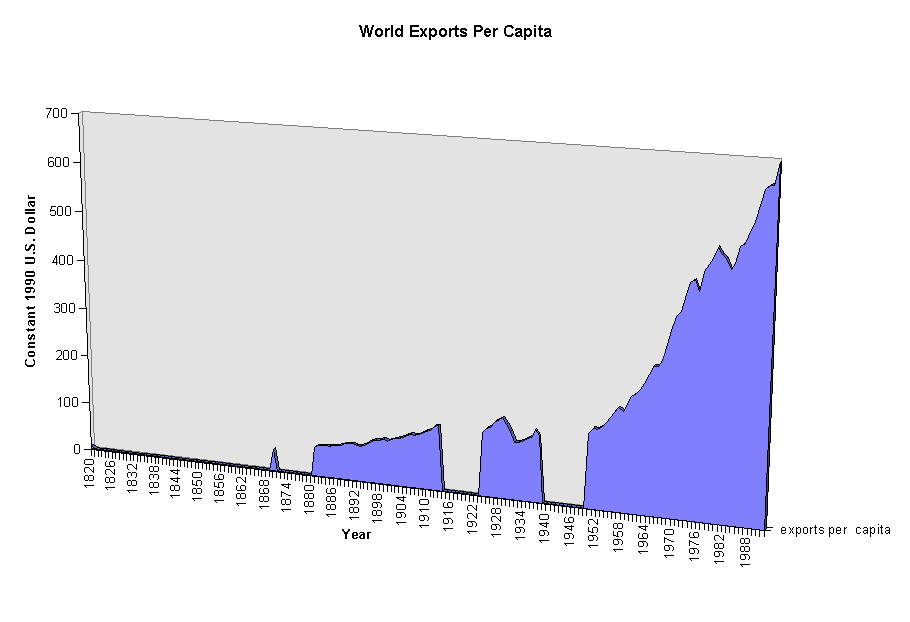
Figure A2:
World Exports Per Capita in constant 1990 U.S. dollars.
Source: Maddison (1995: 226, 239)
Section
1: Weighting by GDP
A reviewer suggested that economic size (GDP)
might be a better weight than population size for the purpose of estimating
a characteristic of the world economy. Weighting by economic size requires
the use of country GDPs that have been converted into constant U.S. dollars,
and so this reintroduces the problematic assumptions about exchange and
inflation rates. Also the GDP figures in constant U.S. dollars from Maddison
(1995:180-192) are available for only 56 countries, and for time points
that are widely spread in the 19th century. Nevertheless, we
interpolated these to produce yearly estimates and used these to calculate
trade globalization weighted by GDP using the same weighting method used
with population, i.e.
Equation 3
Note that in Equation 3 Imports and the country
GDPs used to calculate the openness ratios are in local country currencies,
while the GDP figures used to calculate the weights for each country are
in U.S. dollars. Exchange and inflation assumptions may not be quite as
problematic here since we are only using the exchange and inflation rates
to calculate weights for the openness scores, not the openness ratios themselves.
This weighting using economic size resulted in a trajectory of estimated
trade globalization that is substantially similar to that produced by using
population weights. The Pearsons r correlation coefficient for these two
series is .91. Figure A3 displays the trajectory of trade globalization
weighted by GDP and compares it with the same measure weighted by population.
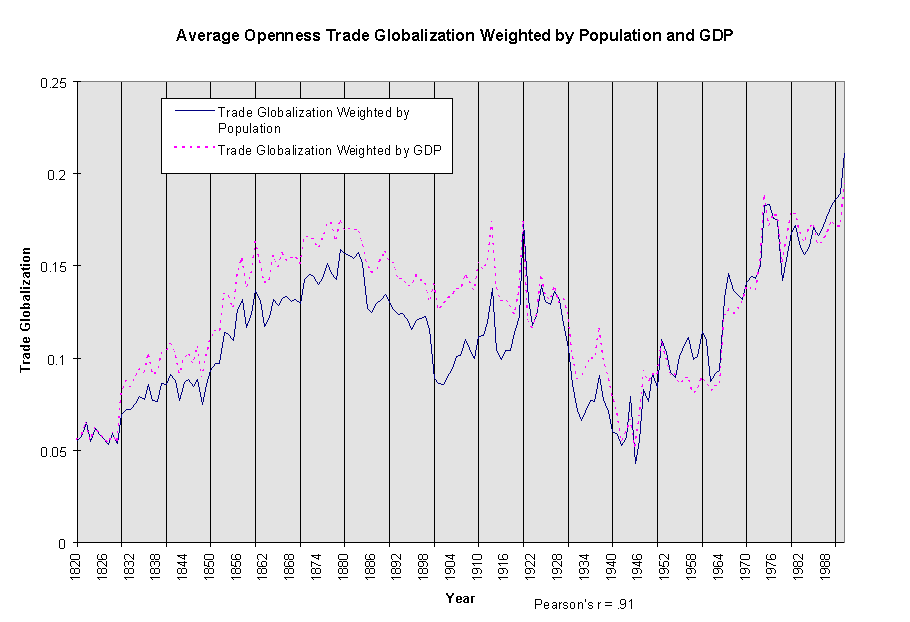
Figure A3:
Average Openness Trade Globalization Weighted by GDP (56 countries) compared
with Population Weighting
Section
2: Checking the new measure of Trade Globalization
The biggest contribution reported in this paper
is our new and improved measure of trade globalization, and thus before
we interpret our results we will examine the new measure more closely.
There are two techniques we can use to check that our "sample" of countries
with available data is providing a reliable estimate of world-wide trade
globalization. The first is to compare our estimated level of trade globalization
based on Average Openness with the World Total approach based on Maddisons
(1995) estimates. For the period after 1950 Maddison has yearly data on
GDP and the problems of the World Totals approach are probably reduced,
because exchange and inflation rates are more reliably known. Thus we can
use Maddisons (1995: 227,239) data to see how our Average Openness measures
compare after 1950.
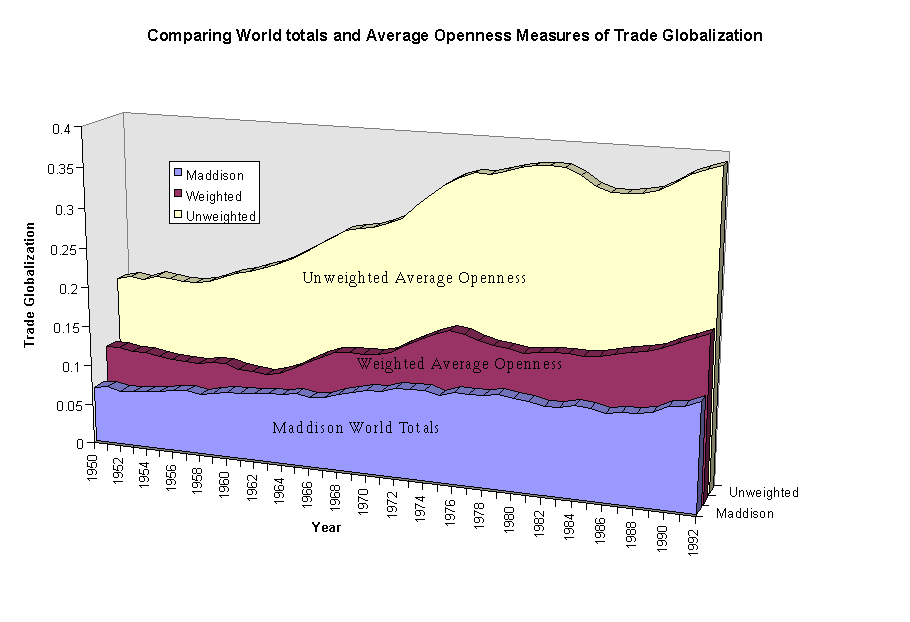
Figure A4: World Totals
and Average Openness Measures, 1950-1992
Figure A4 indicates that the Average Openness
measures may overestimate the levels of trade globalization. Especially
the unweighted Average Openness does this, probably because the small countries
with high levels of openness are over-weighted and raise the level of the
estimates. The weighted Average Openness is a much closer estimate of the
real levels of trade globalization in this period.
The other big difference between the two series
is in 1913 when the unweighted series spikes to a high of .32. This is
because Switzerland and Belgium enter the data for that year only, with
high openness values (.48 and .77), and also because of the very high openness
scores of the Netherlands during this period (1.39). The Netherlands has
always been a big trading state, but this very high score could be some
kind of error. The weighted series does not show such a large spike because
these are all relatively small countries.
Another technique we can use to examine the errors
due to missing data is to select different subgroups of countries and hold
these groups constant over time and then to compare the groups to see if
they are revealing similar temporal sequences and similar levels of openness.
Our overall measure of average openness trade globalization gradually adds
cases, and so the patterns we observe could be caused by the addition of
cases. If we find that constant subgroups exhibit patterns similar to those
found for the whole data set we may be comforted regarding the proposition
that our restricted sample earlier in time is not a bad estimate of the
true world level of trade globalization, though this will not at all be
certain. The openness values in the constant groups are weighted by the
ratio of the country population to the average population of the group
at each time point.
We can determine the effects of adding cases by
comparing the overall measure with groups of countries in which the cases
are held constant over time, shown in Figure A5.
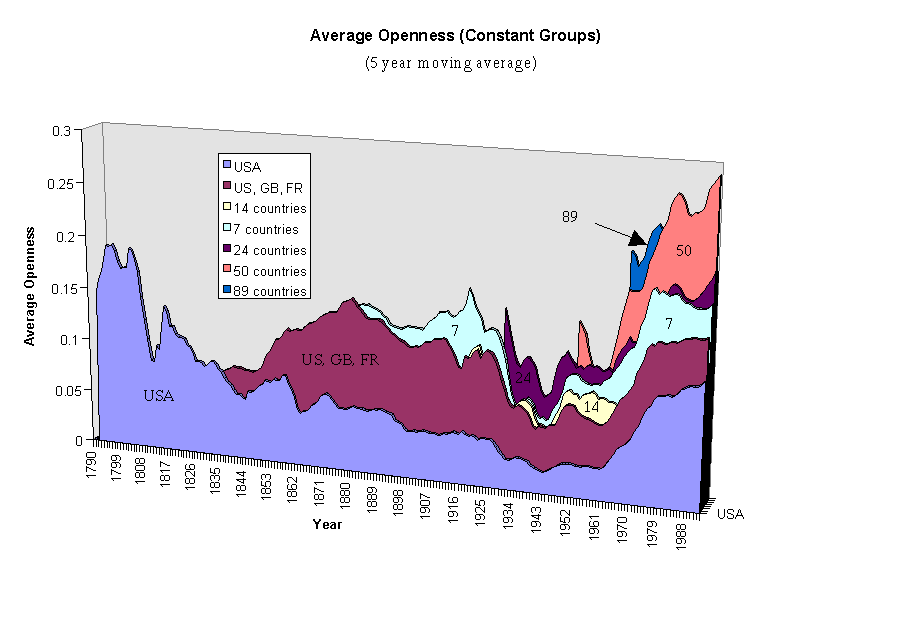
Figure
A5: Average Openness of Constant Groups of Countries (5 year moving
averages)
Figure A5 graphs the weighted Average Openness values for six groups
of countries, with the groups held constant over time so that changing
country composition does not affect the averages. The trajectories get
shorter as we add countries.
The first "group" is the United States, the only country for which we
have data for the whole period from 1795 to 1995. The second group is composed
of the U.S., the United Kingdom and France with average scores beginning
in 1830. The third group, beginning in 1861, adds to these Australia, Denmark,
Italy and Sweden (seven countries). The fourth group (fourteen countries),
beginning in 1905, adds Cuba, Spain, India, Japan, Mexico, the Netherlands
and Taiwan. The fifth group (24 countries) begins in 1927 and adds Austria,
Canada, Colombia, Greece, Guatemala, Honduras, Hungary, Indonesia, South
Africa and Zimbabwe. The sixth group (50 countries), begins in 1950 and
the seventh group with 89 countries begins in 1965.
Inspection of Figure A5 clarifies some aspects of Figure 3 in our paper
and supports the idea that average levels of openness of a subgroup of
countries can be used as a reasonable proxy for both the level of world
trade globalization and for periods of rise and fall in that level. Figure
A5 shows that, except for the U.S., the other groups display generally
similar levels of average trade openness and these levels go up and down
rather synchronously.
Additional support for our overall measure is the table of correlation
coefficients between the group scores and the values estimated using all
the cases. These are shown in Table A1.
| Country
Groups |
USA |
US/GB
France |
Seven |
Fourteen |
Twenty-four |
Fifty |
Eighty-nine |
| All 148 Countries |
.51 |
.84 |
.85 |
.73 |
.92 |
.94 |
.74 |
Table A1: Pearsons r correlation
coefficients of subgroup scores with our estimate of world trade globalization
that uses all data.
While the subgroups vary as to how well they are
correlated with our overall measure, they are all fairly well correlated
with it, except for the United States -- a deviant case.
The erratic fluctuations before 1830 show the
fledgling United States of America fighting its way through a world war
in which it was allied with the losing side. The Continental blockade,
sometimes breached, and poor import statistics probably account for the
wildness of the measure of U.S. trade openness in this period. We include
these data mainly to display the slim reed that is our window on world
trade globalization before 1830. Indeed, the rest of the U.S. performance
until about 1960 shows that the United States by itself continued to be
a poor reflector of world trade globalization. It was not until the 1960s
that the United States experienced increased openness of its trade to the
world division of labor.
The trajectory of U.S. trade openness may not
be a good proxy for the world economy as a whole, but it is an important
window on what happened within the U.S. and its relationship with the larger
world-system. While the rest of the world was going through at least one,
and possibly two waves of trade globalization between 1830 and 1929, the
United States enjoyed a low, and mainly declining, level of trade dependence.
This reflects both tariff protectionism and the relatively fast rate of
growth of U.S. GDP during this period of territorial expansion, as well
as rapid population growth, industrialization and upward mobility into
the core of the world-system. U.S. imports did grow mightily, but the domestic
economy grew even faster.
This amazing performance was the outcome of internal
and international struggles among classes, different sectors within the
same classes, and national states. Indeed, it has been argued elsewhere
that the U.S. Civil War was mainly a struggle over how the U.S. would be
inserted into the larger core/periphery hierarchy (Chase-Dunn 1980). The
struggle over tariff policy between 1816 and the Civil War showed how the
southern exporters of peripheral agricultural products had political and
economic interests that were quite divergent from northern manufacturers.
Was the U.S. to continue as an exporter of agricultural raw materials,
as the other new states in Latin America did, or was it to use the power
of the Federal state to move up the value-added hierarchy into the core
of the world-system? The victory of the north in the Civil War meant a
consistent policy of trade protectionism to promote import substitution
industrialization, a policy that lasted until after World War II. Thus
the U.S. success is a poor example for those who want to argue that free
trade is a central pillar of economic development.
But our focus here is not the trade history of
the individual countries, and neither do we need to assume that all the
countries have the same trajectories of trade openness. Rather we are studying
the whole system, which is composed of diverse parts with different, but
not unrelated, histories.
Another approach for evaluating our Average Openness
measure is to examine systematic differences among countries that may be
affecting our estimates for earlier years. We have already mentioned that
core and peripheral countries often differ in terms of their levels of
openness or trade dependence. Peripheral countries tend to be smaller and
more dependent on imports and exports, although there are also small core
countries with high levels of openness (e.g. Switzerland, the Netherlands).
[Openness is not itself a good measure of dependency. What matters in the
hierarchical division of labor in the world economy is whether the national
exports are high or low in the value-added hierarchy. Little Switzerland,
classically exporting fine watches, has a very different sort of openness
than Honduras, which exports bananas. "Trade composition" is the concept
that captures the nature of exports and imports and this notion has been
studied for the whole world-system using network analysis by Smith and
White (1993).]
One big problem with our measure of trade globalization
is that we have data on few non-core countries early on, so an important
piece of the world-system is missing, and this could be biasing our estimation
of the level of world trade globalization downward. This is cause for concern
because one of the questions we want to answer is whether or not there
is a real upward trend, in addition to the obvious cycles. It is possible
that the high level indicated for recent decades might be due to the addition
of more data on peripheral and semiperipheral countries rather than a real
increase in the level of world-wide trade globalization.
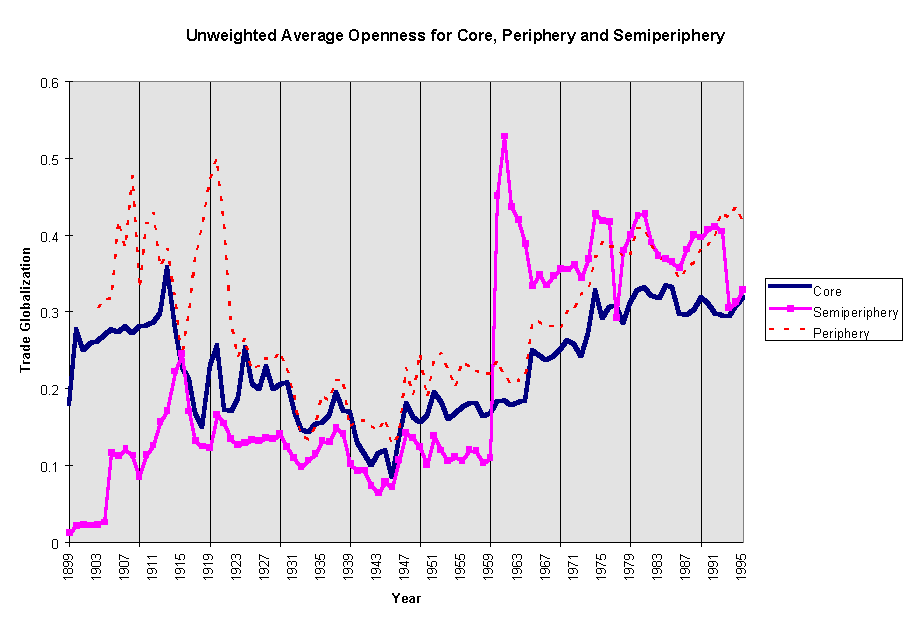
Figure A6: Average Unweighted
Openness Scores for Core , Periphery and Semiperiphery Groups, 1908-1995
We have divided our list of countries into core,
periphery and semiperiphery groups for the period since 1900 following
the multivariate approach formulated by Terlouw (1993) (see lists of countries
in Table A2 below). Figures A6 plots the unweighted values of these groups.
We do not have data for all the countries over the whole time period. Indeed
some countries appear for a year and then are missing again for more than
a decade. This accounts for some of the spikes in Figure A6. It is obvious
that the three groups all experience the same waves of trade globalization,
but there are also interesting differences. The peripheral group consistently
has higher openness scores than the core group. A t-test rejects the hypothesis
of no difference between the mean scores of these groups at greater than
the .001 level, and this holds true even when we exclude the years after
1950 (See Tables A3 and A4 below). The semiperipheral countries were consistently
lower than the core in average openness before 1970, after which time they
became rather higher. The semiperipheral group has always been rather a
mixed bag of countries that are pursuing different kinds of development
strategies.
After 1976, the core countries reached a plateau
that they cycled around until the end of the series, whereas the peripheral
countries rose to a height greater than ever before and then fell back
in the mid 80s and then rose again to their highest height in the early
90s when our series ends. The semiperipheral countries continued to rise
and then fell precipitously to the level of the core in 1990.
These results support the notion that both core
and non-core countries are experiencing changes in trade globalization
synchronously, and that up until 1975 these groups had similar levels of
openness, with peripheral countries usually a bit higher than core countries.
After 1975 we see a divergence. The core countries plateau at level that
is higher than the level reached in the earlier waves of globalization,
while the peripheral countries continued to rise to a much higher level.
Table A2:
Country list showing categorization
of Core, Peripheral and Semiperipheral Countries
| Periphery |
|
Core Countries |
Semiperiphery |
|
|
|
|
| AFG-Afghanistan |
KWT-Kuwait |
USA-United
States |
BRA-Brazil |
| ALB-Albania |
KGZ-Kyrgyz
Republic |
GBR Wales |
CHN-China |
| DZA-Algeria |
LAO-Lao PDR |
FRA-France |
HKG-Hong Kong |
| AGO-Angola |
LVA-Latvia |
AUS-Australia |
IRN-Iran,
Islamic Rep. |
| BHR-Bahrain |
LBN-Lebanon |
DNK-Denmark |
ISR-Israel |
| BGD-Bangladesh |
LSO-Lesotho |
ITA-Italy |
KOR-Korea,
Rep. |
| BRB-Barbados |
LBR-Liberia |
SWE-Sweden |
ZAF-South
Africa |
| BLR-Belarus |
LBY-Libya |
ESP-Spain |
SGP-Singapore |
| BLZ-Belize |
LTU-Lithuania |
JPN-Japan |
MEX-Mexico |
| BEN-Benin |
MAC-Macao |
NLD-Netherlands |
ARG-Argentina |
| BOL-Bolivia |
MKD-Macedonia,
FYR |
AUT-Austria |
IND-India |
| BWA-Botswana |
MDG-Madagascar |
CAN-Canada |
IDN-Indonesia |
| BGR-Bulgaria |
MWI-Malawi |
BEL-Belgium |
Taiwan |
| BFA-Burkina
Faso |
MYS-Malaysia |
CHE-Switzerland |
|
| BDI-Burundi |
MLI-Mali |
DEU-Germany |
|
| KHM-Cambodia |
MRT-Mauritania |
NZL-New Zealand |
|
| CMR-Cameroon |
MUS-Mauritius |
IRL-Ireland |
|
| CAF-Central
African Republic |
MDA-Moldova |
NOR-Norway |
|
| TCD-Chad |
MNG-Mongolia |
FIN-Finland |
|
| CHL-Chile |
MAR-Morocco |
PRT-Portugal |
|
| COL-Colombia |
MOZ-Mozambique |
|
|
| COG-Congo |
MMR-Myanmar |
|
|
| CRI-Costa
Rica |
NAM-Namibia |
|
|
| CIV-Cote d'Ivoire |
NPL-Nepal |
|
|
| HRV-Croatia |
NIC-Nicaragua |
|
|
| CUB-Cuba |
NER-Niger |
|
|
| CYP-Cyprus |
NGA-Nigeria |
|
|
| CZE-Czech
Republic |
OMN-Oman |
|
|
| DOM-Dominican
Republic |
PAK-Pakistan |
|
|
| ECU-Ecuador |
PAN-Panama |
|
|
| EGY-Egypt,
Arab Rep. |
PNG-Papua
New Guinea |
|
|
| SLV-El Salvador |
PRY-Paraguay |
|
|
| ERI-Eritrea |
PER-Peru |
|
|
| EST-Estonia |
PHL-Philippines |
|
|
| ETH-Ethiopia |
POL-Poland |
|
|
| RWA-Rwanda |
PRI-Puerto
Rico |
|
|
| SAU-Saudi
Arabia |
ROM-Romania |
|
|
| GAB-Gabon |
RUS-Russian
Federation |
|
|
| GMB-Gambia,
The |
SEN-Senegal |
|
|
| GEO-Georgia |
SLE-Sierra
Leone |
|
|
| GHA-Ghana |
LKA-Sri Lanka |
|
|
| GRC-Greece |
SDN-Sudan |
|
|
| GTM-Guatemala |
SUR-Suriname |
|
|
| GIN-Guinea |
SYR-Syrian
Arab Republic |
|
|
| GNB-Guinea-Bissau |
TZA-Tanzania |
|
|
| GUY-Guyana |
THA-Thailand |
|
|
| HTI-Haiti |
TGO-Togo |
|
|
| HND-Honduras |
TTO-Trinidad
and Tobago |
|
|
| ARE-United
Arab Emirates |
TUN-Tunisia |
|
|
| URY-Uruguay |
TUR-Turkey |
|
|
| HUN-Hungary |
UGA-Uganda |
|
|
| IRQ-Iraq |
VEN-Venezuela |
|
|
| YEM-Yemen,
Rep. |
VNM-Vietnam |
|
|
| YUG-Yugoslavia,
FR (Serbia/Montenegro) |
ZMB-Zambia |
|
|
| ZAR-Zaire |
ZWE-Zimbabwe |
|
|
| JAM-Jamaica |
|
|
|
| JOR-Jordan |
|
|
|
| KAZ-Kazakstan |
|
|
|
| KEN-Kenya |
|
|
|
____________________________________________________________________________________
| t-Test:
Two-Sample Assuming Unequal Variances |
|
|
core vs. periphery 1908-1995
|
|
|
|
Core
|
Periphery
|
| Mean |
0.225598273
|
0.288585325
|
| Variance |
0.004604849
|
0.009302946
|
| Observations |
88
|
88
|
| Hypothesized
Mean Difference |
0
|
|
| df |
156
|
|
| t
Stat |
-5.010296877
|
|
| P(T<=t)
one-tail |
7.28752E-07
|
|
| t
Critical one-tail |
2.350489012
|
|
| P(T<=t)
two-tail |
1.4575E-06
|
|
| t
Critical two-tail |
2.607703209
|
|
Table A3: T-test
of mean differences between Core and Periphery Average Openness Scores
(Unweighted), 1908-1995
| t-Test:
Two-Sample Assuming Unequal Variances |
|
|
core vs. periphery 1908-1949
|
|
|
|
Core
|
Periphery
|
| Mean |
0.193067921
|
0.259427199
|
| Variance |
0.003638978
|
0.011485727
|
| Observations |
42
|
42
|
| Hypothesized
Mean Difference |
0
|
|
| df |
65
|
|
| t
Stat |
-3.496897049
|
|
| P(T<=t)
one-tail |
0.000427012
|
|
| t
Critical one-tail |
2.385095286
|
|
| P(T<=t)
two-tail |
0.000854023
|
|
| t
Critical two-tail |
2.653614501
|
|
Table A4:
T-test of mean differences between Core and Periphery Average Openness
Scores (Unweighted), 1908-1949
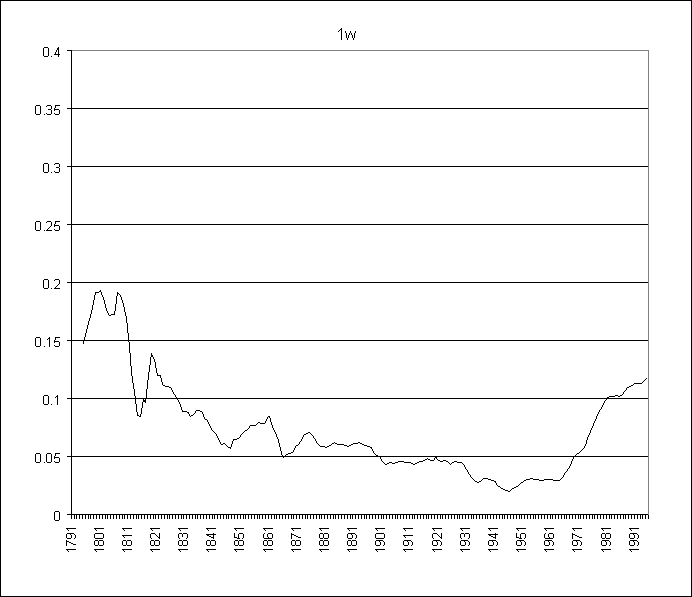
Figure A7:
Imports/GDP for the United States
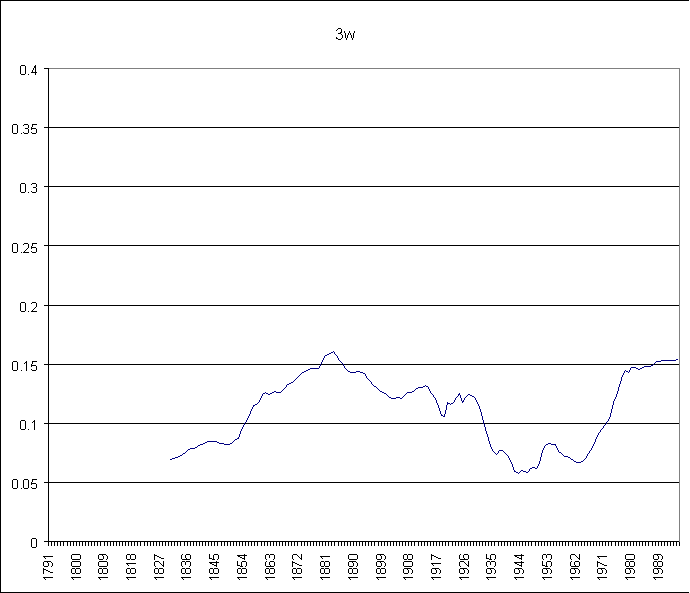
Figure A8:
Average Openness for the U.S., Great Britain and France
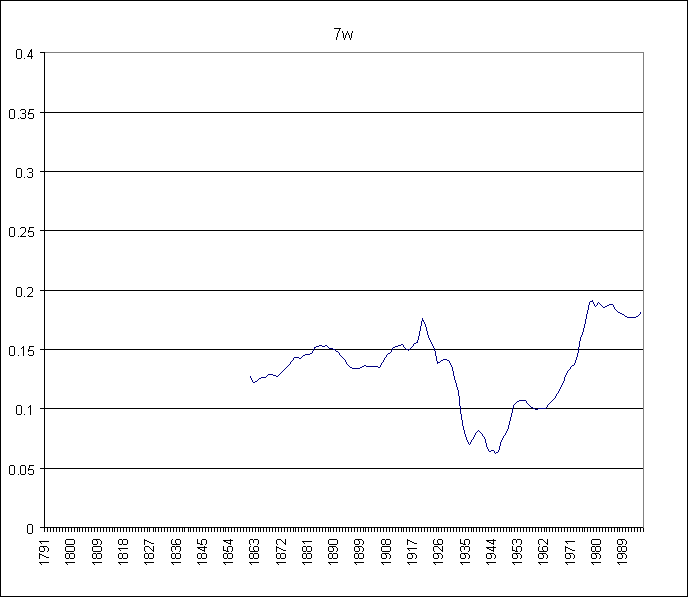
Figure A9:
Average Openness for the Group of 7.
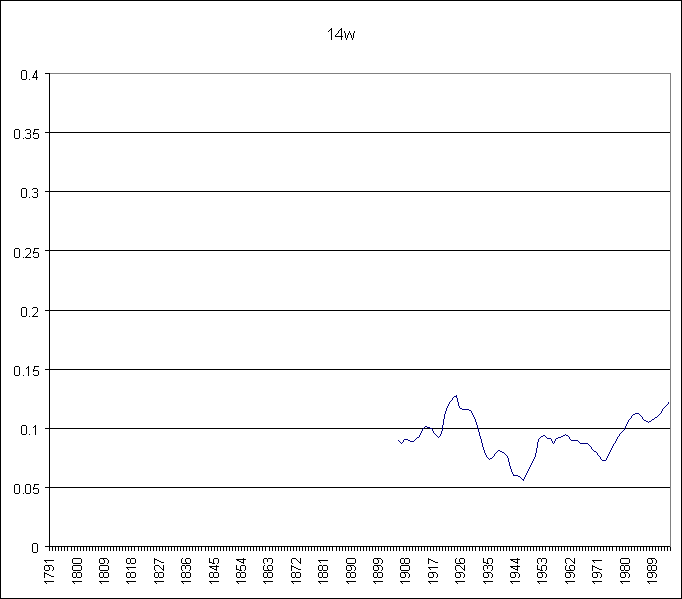
Figure A10:
Average Openness for the Group of 14.
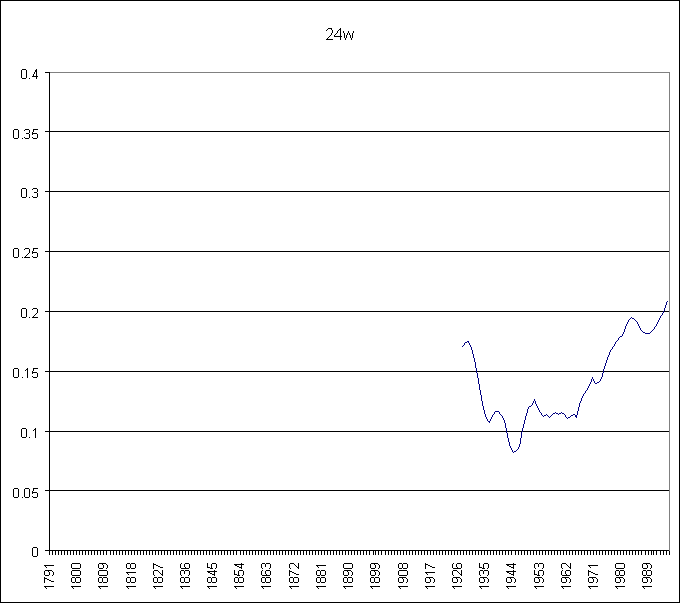
Figure A11:
Average Openness for the group of 24.
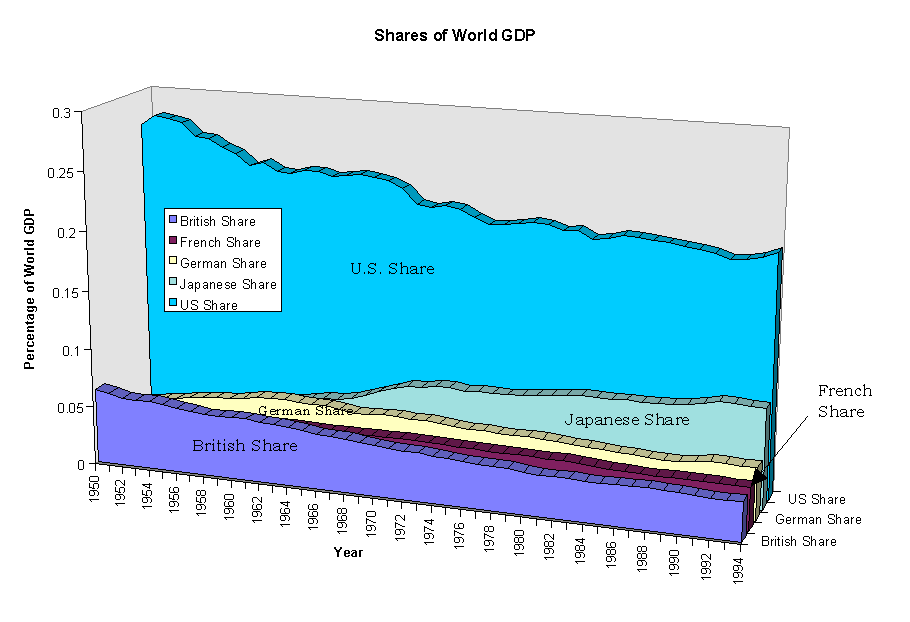
Figure A12:
Core Country Shares of World GDP
Source: Maddison (1995:180,227)
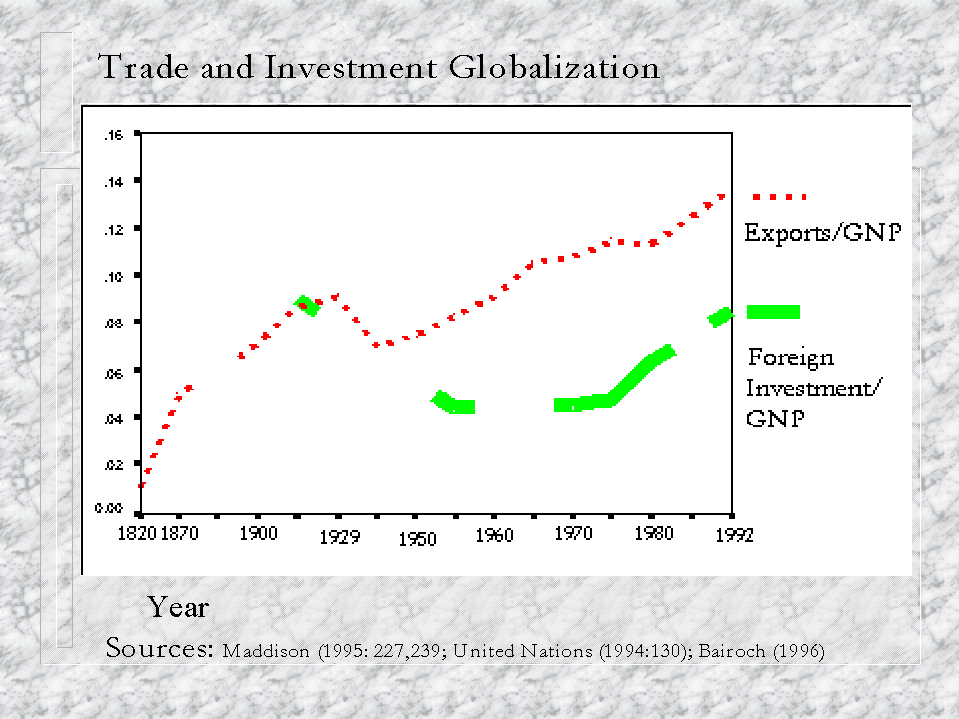
Figure
A13: Trade and Investment Globalization