Polity Upsweeps and Collapses Inventory
Appendix
![]()
Institute
for Research on World-Systems
v. 10-4-12
Appendix to “Polity Scale Shifts Since the Bronze Age: An Inventory of Upsweeps and Collapses”
Hiroko Inoue, Alexis Álvarez, Kirk Lawrence, Anthony Roberts,
E.N. Anderson and Christopher
Chase-Dunn
Institute for Research on World-Systems, University of California-Riverside
This
research was supported by National Science Foundation Grant #: NSF-HSD
SES-0527720.
Paper published in the International Journal of Comparative
Sociology
Appendix
Table of Contents
Excel data files of polity sizes: Mesopotamia, Egypt, Central System, South Asia, East Asia
Excel
data file with polities upsweeps and downsweeps counts
Table A1: List of Sweeps and
comparison of two methods of calculation
Table A2: Cycles and Sweep
Rates Over Time
Figure A1: Largest polities in the
Central and East Asian PMNs
Subsample error estimation
tables: Robustness Analysis of Non-Uniform
Time-Series
Figures
from the paper
Table A1: List of Sweeps
and comparison of two counting methods
The two methods:
(1) Compared
with smallest / largest:
comparing with largest/smallest of the peaks of the preceding three cycles
(2)
Compared with the average: comparing with the average of
the peaks of the preceding three cycles
Mesopotamia
2800 BCE
to 1500 BCE
Upsweep
|
Year |
size |
Polity name |
comp w largest |
comp w average
|
|
-2400 |
0.05 |
Lagash |
1 (3471%) |
1 (3471%) |
|
-2250 |
0.8 |
Akkadia |
1 (1500%) |
1 (3013%) |
|
-1450 |
0.3 |
Mitanni |
--- (20%) |
1 (100%) |
|
Sweep total |
|
|
2 |
3 |
|
Ups total |
6 |
6 |
Down
sweep
|
year |
size |
Polity name |
comp w smallest |
comp w average |
|
-2150 |
0 |
Akkadia |
--- (3233%) |
1 (-34%) |
|
Sweep total |
|
|
0 |
1 |
|
Downs total |
5 |
5 |
Egypt
2850 BCE
to 1500 BCE
Upsweep
|
Year |
Size |
Polity name |
comp w largest |
comp w average |
|
-2400 |
0.4 |
5th Dynasty |
1 (300%) |
1 (300%) |
|
-1850 |
0.5 |
12th Dynasty |
--- (25%) |
1 (100%) |
|
-1650 |
0.65 |
Hyksos |
--- (30%) |
1 (95%) |
|
Sweeps total |
|
|
1 |
3 |
|
Ups total |
4 |
4 |
Downsweep
|
Year |
Size |
Polity name |
comp w smallest |
comp w average |
|
-1630 |
0.08 |
Hyksos |
--- (60%) |
1 (-55%) |
|
Sweeps total |
|
|
0 |
1 |
|
Downs total |
|
|
3 |
3 |
Central PMN
-1500
BCE to 1991AD
Upsweep
|
Year |
Size |
Polity name |
comp w largest |
comp w average |
|
-1450 |
1 |
18th Dynasty |
--- (25%) |
1 (114%) |
|
-670 |
1.4 |
Assyria |
1 (40%) |
1 (87%) |
|
-480 |
5.4 |
Achaemenid Persia |
1 (286%) |
1 (440%) |
|
117 |
5 |
Rome |
--- (28%) |
1 (105%) |
|
750 |
11.1 |
Abbasids |
1 (122%) |
1 (178%) |
|
1294 |
29.4 |
Mongol/Yuan |
1 (654%) |
1 (902%) |
|
1936 |
34.5 |
Britain |
1 (245%) |
1 (505%) |
|
Sweeps total |
|
|
5 |
7 |
|
Ups total |
27 |
27 |
Downsweep
|
Year |
Size |
Polity name |
comp w smallest |
comp w average |
|
-200 |
0.5 |
Parthia |
1 (-80%) |
1 (-84%) |
|
-150 |
0.65 |
Rome |
--- (30%) |
1 (-68%) |
|
882 |
1.3 |
Kiev |
1 (-38%) |
1 (-74%) |
|
962 |
2.05 |
Samanid |
--- (58%) |
1 (-55%) |
|
972 |
2.1 |
Fatimid-Ayyubid-Mameluk |
--- (62%) |
1 (-54%) |
|
1200 |
1 |
Fatimid-Ayyubid-Mameluk |
--- (- 29%) |
1 (-45%) |
|
1478 |
1.24 |
Timur |
1 (-50%) |
1 (-69%) |
|
Sweeps total |
|
|
3 |
7 |
|
Downs total |
27 |
27 |
East Asia
1300 BCE to 1830 AD
Upsweep
|
Year |
Size |
Polity name |
comp w largest |
comp w average |
|
-1050 |
1.25 |
Western Zhou (Chou) |
1 (178%) |
1 (178%) |
|
-176 |
4.03 |
Xiongnu (Hsiung-nu) |
1 (222%) |
1 (374%) |
|
-50 |
6 |
Western Han |
1 (49%) |
1 (214%) |
|
100 |
6.5 |
Eastern (Later) Han |
--- (8%) |
1 (73%) |
|
624 |
1.5 |
E. Turks |
1 (33%) |
1 (35%) |
|
660 |
4.9 |
Tang (T'ang) |
--- (23%) |
1 (34%) |
|
1294 |
29.4 |
Mongol/Yuan |
1 (635%) |
1 (809%) |
|
1790 |
14.7 |
Qing |
--- (-50%) |
1 (33%) |
|
Sweeps total |
|
|
5 |
8 |
|
Ups total |
17 |
17 |
Downsweep
|
Year |
Size |
Polity name |
comp w smallest |
comp w average |
|
-1700 |
0.4 |
Xia (Hsia) |
--- |
--- |
|
-600 |
0.05 |
Western Zhou (Chou) |
1 (-88%) |
1 (-88%) |
|
221 |
1.5 |
Wu |
--- (2900%) |
1 (-58%) |
|
316 |
2 |
Earlier Zhao (Chao) |
--- (33%) |
1 (-41%) |
|
502 |
1.3 |
Huns / Tuoba |
--- (-13%) |
1 (-35%) |
|
907 |
0.8 |
Tang
(T'ang)- Jin (Chin) - Song (Sung) |
1 (-74%) |
1 (-77%) |
|
947 |
0.5 |
Liao (Kitan) |
1 (-38%) |
1 (-84%) |
|
Sweeps total |
|
|
3 |
6 |
|
Downs total |
17 (Qing’s starting down is counted) |
17 (Qing’s starting down is counted) |
South Asia
-420 BCE
to 1008 AD
Upsweep
|
Year |
Size |
Polity name |
comp w largest |
comp w average |
|
-260 |
3.72 |
Mauryan |
--- |
1 (---) |
|
Sweeps total |
|
|
0 |
1 |
|
Ups total |
5 |
5 |
Downsweep
|
Year |
Size |
Polity name |
comp w smallest |
comp w average |
|
-130 |
1.9 |
Mauryan |
--- |
1 (---) |
|
330 |
0.97 |
Kusanas |
1 (-49%) |
1 (-49%) |
|
600 |
0.05 |
Gupta |
1 (-95%) |
1 (-97%) |
|
1050 |
0.2 |
Rastrakutas |
--- (300%) |
1 (-72%) |
|
Sweeps total |
2 |
4 |
||
|
Downs total |
5 |
5 |
Two different counting methods compared
Upsweeps and downsweeps represent the major changes in the scale of
polities that form 33% increase or decrease of polity size from the previous level.
A peak is any data point that is preceded and followed by data points that are
smaller than it is. A trough is any data point that is preceded and followed by
data points that are larger than it it. Each peak or
trough data point is compared with preceding three peaks or troughs to
determine if that data point constitutes an upsweep or downsweep.
But this comparison can be done in several possible ways. In determining this, we applied the following
two methods.
(1) Comparison of
each peak or trough data point with the average of preceding three peak or
trough data points.
In order to determine
whether or not a data point is a downsweep, the trough
data point is compared with the average of preceding three low points
(troughs). In order to determine whether or not at peak data point is an
upsweep, the data point is compared with the average of preceding three peaks.
(2) Comparison of
each peak or trough data point with the smallest (for downsweep)
or largest (for upsweep) among preceding three peak or trough data points.
In order to determine whether or
not a data point is a downsweep, the trough data
point is compared with the smallest among preceding three trough data points;
in order to determine whether or not a data point is an upsweep, the peak data point is compared with the largest among
preceding three peak data points.
We decided to use
the method (1) for determining the upsweeps and downsweeps
in our paper. The cutting point that
forms upsweep or downsweep is 33% growth or decline
from the previous reference data. The
method (2) is presented for comparative purposes to see how frequently to two
methods converge or diverge.
Example:
The following is
an example of cases from East Asia about how we determined the upsweeps or downsweeps. Method 1
from this example was applied to all five regions of our study.
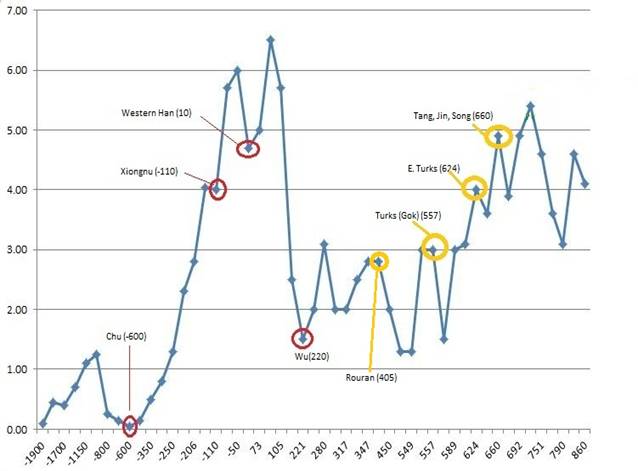
Figure 1. Growth and
decline of largest empire sizes in square megameters
in East Asia between 1900 BCE and 860 CE
Figure 1 shows
the growth and decline of the largest empires in East Asia data from 1900 BCE
to 860 CE. The red
circles represent the trough data
points used to determine if Wu (220 AD) formed a downsweep
(presented in the left side of the graph); the yellow circles
represent the peak data points used to determine if Tang, Jin, or Song (660AD)
made an upsweep (presented in the right side of the graph)
Upsweeps
In order to
determine whether the data point peak of Tang, Jing, or Song (660AD) forms an upsweep
or not, we compare it with the three previous peaks ( Eastern Turks (624AD), GokTurk, 557AD) and Rouran (405AD) [yellow circles in the graph].
Both methods 1
and 2 are applied for comparison.
Method (1)
The rate of
increase of the peak of Tang, Jing, or Song (660) from the average of the peaks
of the Eastern Turks, the GokTurks and Rouran is calculated. The sizes of the thee data points are:
Tang, Jing, Song =4.9, Eastern Turks= 4, GokTurks=3,and Rouran=2.8. Thus,
the increase rate is:
![]()
It shows a 50% increase.
Since it is more than 33%, we decide
Tang, Jing, Song (660) forms an upward sweep.
Method (2)
The
rate of increase for the Tang, Jing, Song (660) peak is compared with the largest
size among the three preceding peaks. This is Eastern Turk with size 4. Thus the increase rate is:
![]()
By
rounding, it is 23 % increase, and it is less than 33%. Using method (2), we do not categorize Tang,
Jing, Song (660) as an upsweep.
Downsweeps
In order to
determine whether or not Wu (220 AD) formed a downsweep
we compared its size with the previous three troughs. These include the Western
Han (10AD), the Xiongnu (110BCE), and the Chu
(600BCE) [red circles in the graph].
Method (1)
The rate of decline
of the Wu trough is compared with the average of the sizes of Western Han, Xiongnu, and Chu troughs. The sizes are: Wu=1.5, Western Han=4.7, Xiongnu=4 and Chu=.05.
Thus the decline rate is:
![]()
By rounding, it
is a 49% decline. Comparing with the
average of preceding three points, Wu shows a downsweep
with more than 33% change. Thus, we
determine Wu should be categorized as a downsweep.
Method (2)
The
rate of decline of the Wu trough is compared with the smallest size among the
three preceding troughs. This is Chu=.05.
The decline rate is:
![]()
This
shows 2900 % increase from Chu to Wu because the smallest of the previous three
(Chu) is smaller than Wu. Thus by this method Wu would not be considered a
downsweep.
We prefer Method 1 because it is less vulnerable to single
deviations of the kind shown in the example of Wu.
Table A2: Cycles and Sweep Rates Over
Time
Method:
The total length of the
period for each region is divided by 5 equal intervals (phase1 to 5). The
number of cycles and sweeps in 5 regions are counted in the 5 intervals.
Mesopotamia
-2800~-1500
(1300
yrs)
|
|
interval 260 years |
# of cycle |
# of upsweeps |
# of down
sweeps |
|
phase1 |
- 2800 ~ -2540 |
0.5 |
0 |
0 |
|
phase2 |
-2540 ~ - 2280 |
1 |
1 |
0 |
|
phase3 |
-2280 ~ - 2020 |
1 |
1 |
1 |
|
phase4 |
-2020 ~ - 1760 |
2 |
0 |
0 |
|
phase5 |
- 1760 ~ -
1500 |
1.5 |
1 |
0 |
Egypt
-2850~ - 1500
(1350 yrs)
|
|
interval 270 years |
# of cycle |
# of upsweeps |
# of down
sweeps |
|
phase1 |
- 2850 ~ -2580 |
0.5 |
0 |
0 |
|
phase2 |
-2580 ~ - 2310 |
0.5 |
1 |
0 |
|
phase3 |
-2310 ~ - 2040 |
0.5 |
0 |
0 |
|
phase4 |
-2040 ~ - 1770 |
0.5 |
1 |
0 |
|
phase5 |
-1770 ~ -1500 |
2 |
1 |
1 |
Central PMN
-1500~2000
|
(3500
yrs) |
interval 700 years |
# of cycle |
# of upsweeps |
# of down
sweeps |
|
phase1 |
-1500 ~ -800 |
2.5 |
1 |
0 |
|
phase2 |
-800 ~ -100 |
8.5 |
2 |
2 |
|
phase3 |
-100 ~ 600 |
2 |
1 |
0 |
|
phase4 |
600 ~ 1300 |
10 |
1 |
4 |
|
phase5 |
1300 ~ 2000 |
4 |
2 |
1 |
East Asia
-1300~1830
(3130 yrs)
|
|
interval 626 years |
# of cycle |
# of upsweeps |
# of down
sweeps |
|
phase1 |
-1300 ~ -674 |
1 |
1 |
0 |
|
phase2 |
-674 ~ -48 |
1.5 |
2 |
1 |
|
phase3 |
-48 ~ 578 |
3.5 |
1 |
3 |
|
phase4 |
578 ~ 1204 |
8 |
2 |
2 |
|
phase5 |
1204 ~ 1830 |
3 |
2 |
0 |
South Asia
-420~1008
(1428
yrs)
|
|
interval 285.6 years |
# of cycle |
# of upsweeps |
# of down sweeps |
|
phase1 |
-420 ~ -134.4 |
1 |
1 |
0 |
|
phase2 |
-134.4 ~ 151.2 |
0.5 |
0 |
1 |
|
phase3 |
151.2 ~ 436.8 |
1 |
0 |
1 |
|
phase4 |
436.8 ~ 722.4 |
1.5 |
0 |
1 |
|
phase5 |
722.4 ~ 1008 |
1 |
0 |
1 |
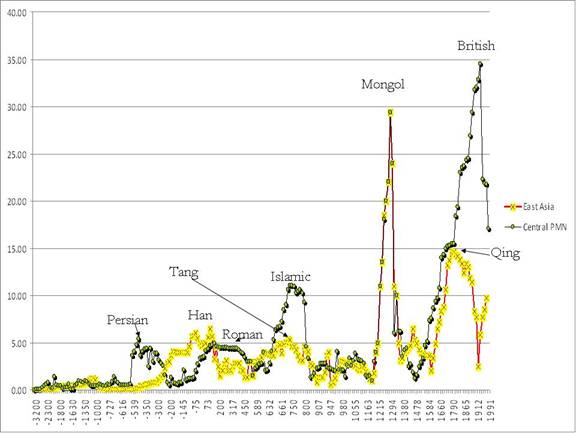
Figure A1: Largest polities in the Central and East Asian PMNs
Subsample error estimation
tables: Robustness Analysis of
Non-Uniform Time-Series
Two important problems for
our analysis are:
1. large differences
in the number of largest polity size estimates across regions, and
2. the non-uniformity
of the time intervals between estimates for each region.
Bronze Age estimates from
Mesopotamia, Egypt and East Asia were farther apart in time, and we had fewer
estimates overall for Mesopotamia and Egypt. This could have meant that we were
missing important changes in the sizes of largest polities. We know that there
is a missing estimate for the Uruk polity in
We
performed a secondary analysis to address the critical issue of having a
non-uniform time-series when estimating the average time to upswings, upsweeps,
downswings and downsweeps (events). We measured the
number of years per event by multiplying the number of time points per event by
several mean interval lengths. This allows us to simulate a uniform time-series
for our estimates while accounting for uncertainty of our sample. By controlling for the unevenness and comparing
the results of this analysis to the reported results, we can better determine
whether the non-uniformity in our time-series influences the estimates for the
average number of years between events.
Table 1 shows the variation
in the time intervals between estimates and in the total number of estimates
for each region. The smallest sample of
estimates is for the Mesopotamia region, with 20 estimates. The largest sample of estimates is for the
A critical assumption underlying the analysis is that the average length of intervals between observations in the time-series is a function of some unobserved stochastic process. Given this assumption, we constructed an average interval length for each region and a confidence interval for the average length. For example, in Mesopotamia, the average interval between estimates is 72.5 years, where intervals ranged from 10 years to 300 years. Assuming that the average interval length is a product of our ‘sample’ of intervals, in the ‘population’ of intervals, we would expect that the average interval length should be between 44 to 101 years for Egypt. Therefore, for calculating the average number of years to an event, we use the average, lower limit average, and upper limit average interval lengths were used.
Table 1. Estimate Intervals in Regional Time-Series
|
|
Mesopotamia |
Egypt |
Central
PMN |
East
Asia |
South
Asia |
|
|
N |
20 |
117 |
123 |
91 |
24 |
|
|
Avg
Interval |
72.5 |
20 |
29 |
38 |
64 |
|
|
Min
Interval |
10 |
450 |
1 |
0 |
4 |
|
|
Max
Interval |
300 |
117 |
140 |
400 |
280 |
|
|
SD
Interval |
65 |
34 |
28 |
57 |
66 |
|
|
SE
Interval |
15 |
50 |
2.5 |
6 |
13 |
|
|
95%
LCL |
44 |
71 |
24 |
27 |
38 |
|
|
95%
UCL |
101 |
183 |
34 |
50 |
90 |
|
|
Note: N = Total
Number of Estimates. |
||||||
Tables 2 and 3 show the
results from re-estimating the duration of intervals between estimates based on
the average interval length for each region. The time between estimates was
calculated by multiplying the number of estimates per event by the average
interval length, the 95% lower limit of average interval length, and the upper
limit average. The analysis provides an
average year per event and an interval estimate for the average year per
event. According to the results in
Tables 2 and 3, the unevenness of estimates across region has little effect on
the estimated duration of intervals between events. Comparing Tables 2 and 3 to the results
presented in the paper, we see that there are few significant difference
between the point estimates (average years per event) and the interval
estimates.
|
Table
2. Duration Analysis of Upswings and
Upsweeps. |
||||||||
|
|
Estimates
per Upsweep |
Estimates
per Upswing |
Average
Years per Upsweep |
Average
Years per Upswing |
Interval
Estimate for Average Year per Upsweep |
Interval
Estimate for Average Year per Upswing |
||
|
Mesopotamia |
7 |
3 |
483 |
242 |
294 |
673 |
147 |
337 |
|
Egypt |
4 |
3 |
467 |
350 |
201 |
732 |
151 |
549 |
|
Central
PMN |
18 |
5 |
503 |
130 |
416 |
589 |
108 |
153 |
|
East
Asia |
11 |
5 |
436 |
205 |
304 |
569 |
143 |
268 |
|
South
Asia |
24 |
5 |
1534 |
307 |
901 |
2167 |
180 |
433 |
|
Table 3.
Duration Analysis of Downswings and Downsweeps. |
||||||||
|
|
Estimates per Downsweep |
Estimates per Downswing |
Average Years per Downsweep |
Average Years per
Downswing |
Interval Estimate for
Average Years per Downsweep |
Interval Estimate for
Average Years per Downswing |
||
|
Mesopotamia |
20 |
4 |
1450 |
290 |
881 |
2019 |
176 |
404 |
|
Egypt |
12 |
3 |
1400 |
350 |
604 |
2196 |
151 |
549 |
|
Central PMN |
18 |
5 |
503 |
130 |
416 |
589 |
108 |
153 |
|
East Asia |
15 |
5 |
582 |
205 |
405 |
758 |
143 |
268 |
|
South Asia |
6 |
5 |
383 |
307 |
225 |
542 |
180 |
433 |
Figures from “Polity Scale Shifts Since the Bronze
Age: An Inventory of Upsweeps and Collapses”
Figure 1: Types of medium-term scale change in the largest polity in an interacting set of polities
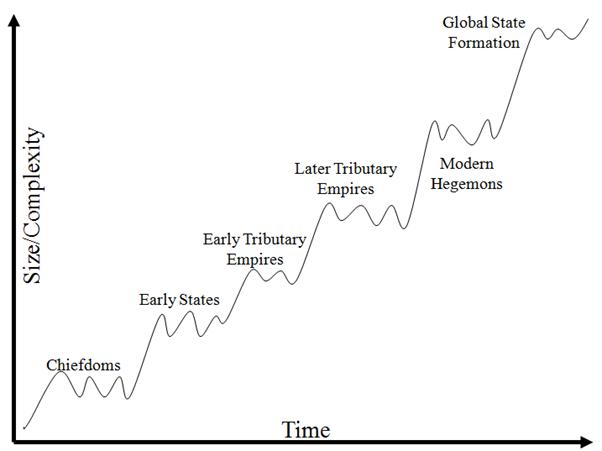
Figure 2: Rise, Decline and Upsweeps of Largest Polity Sizes
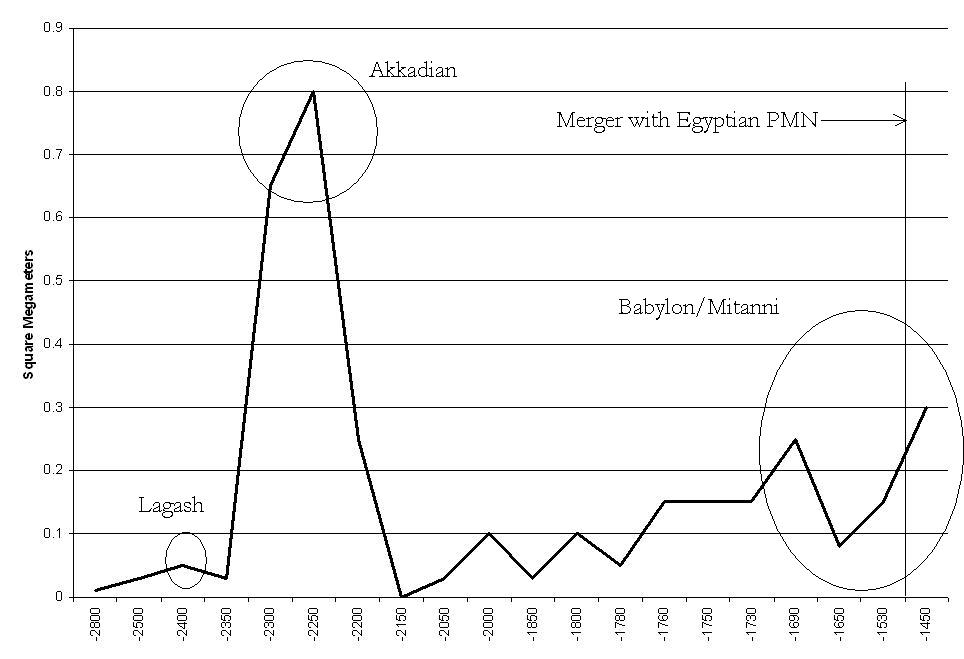
Figure 3: Largest polities in the Mesopotamian Region, 4500 BCE-1450 BCE
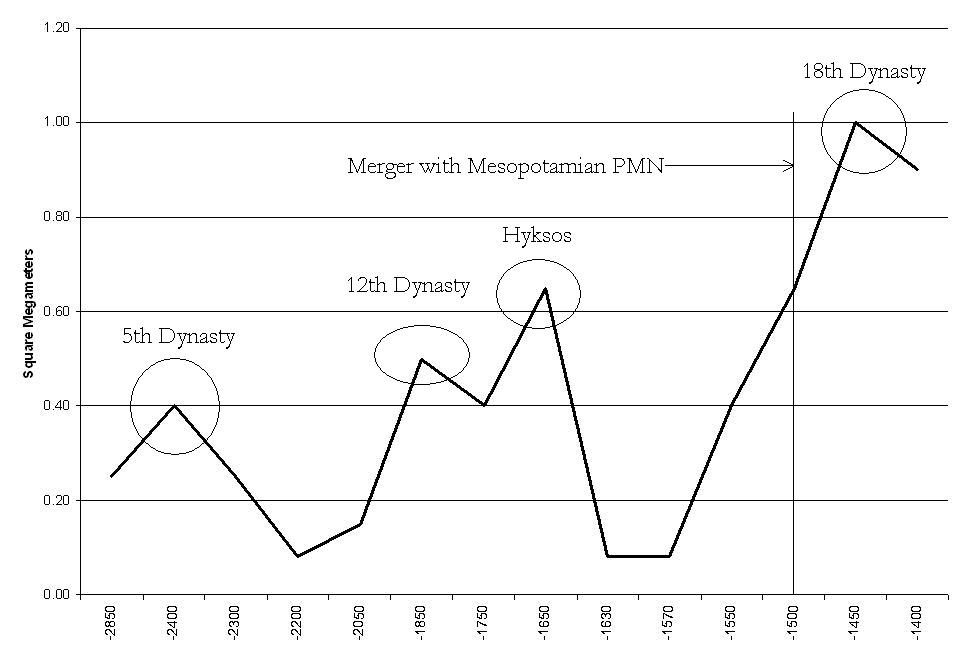
Figure 4: Largest states and empires in Egypt, 2850 BCE-1400 BCE
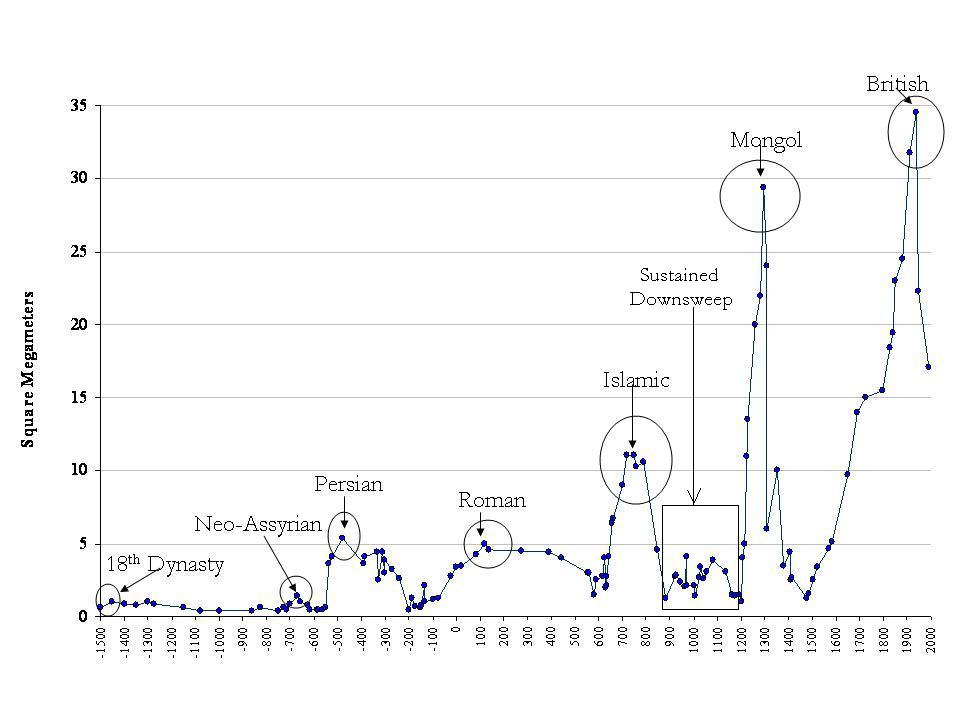
Figure 5: Largest Empires in the Central System, 1500 BCE- 1990 CE
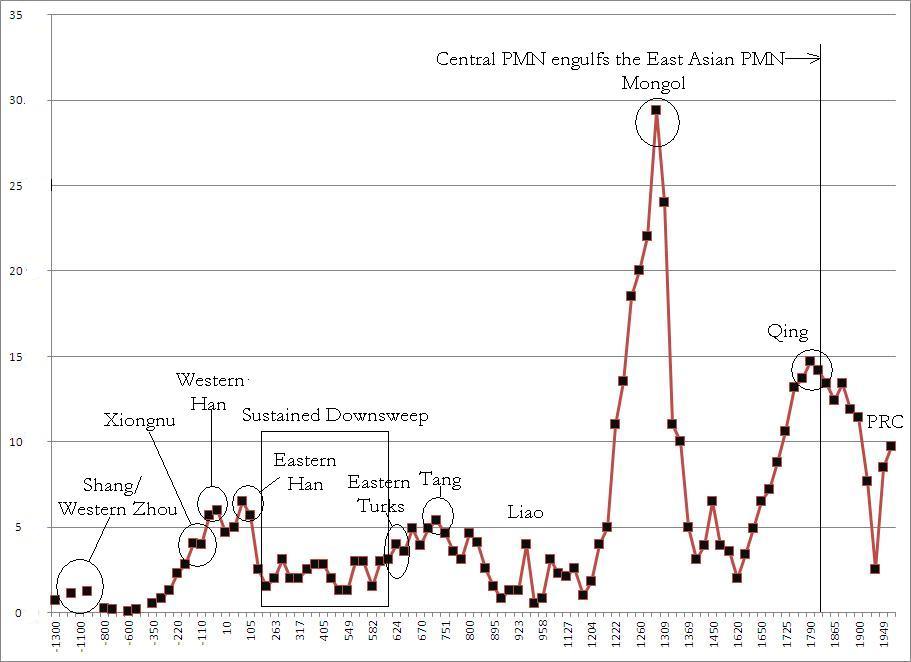
Figure 6: Largest Polities in the East Asian Region, 1900 BCE-1950 CE
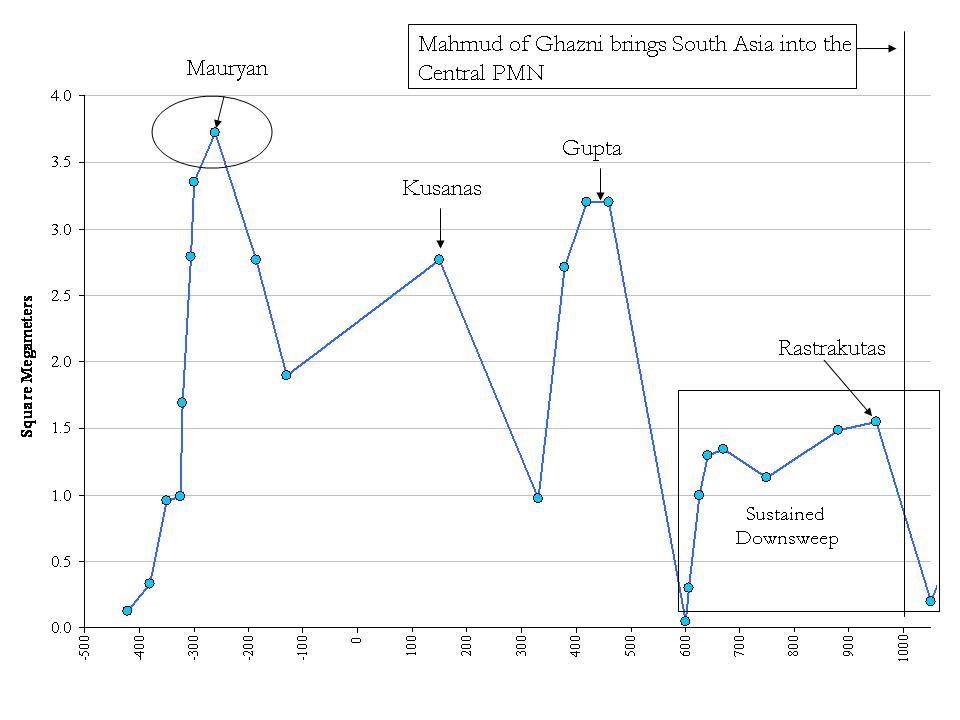
Figure 7:
Largest states and empires in