Deglobalization of the Core:
A Formal Network Analysis

Jisoo Kim
<jkim356@ucr.edu>
Institute for Research on World-Systems (IROWS)
University of California-Riverside
This is IROWS Working Paper #140 available at https://irows.ucr.edu/papers/irows140/irows140.htm
v. 4-13-2021 5737 words
An earlier version was presented at the Annual Meeting of the International Studies Association, April 8,2021
Abstract
Amidst an unprecedented global pandemic and its effects on the world economy, globalization has become a popular topic for research and discussion. Structural globalization, also referred to as connectedness, in the trade network has experienced waves and cycles of globalization since the 19th century. The current world-system may be experiencing yet another cycle of deglobalization due to the halt of the global economy, but this trend may have begun before the Covid-19 pandemic. This study focuses on the connectedness and volume of international trade and introduces formal network analysis to determine the trend of globalization in twenty of the most developed countries (Core) as well as the rest of the world. An analysis of density and centrality in the world trade system are conducted and compared to traditional trade globalization. This research further investigates the implications of deglobalization on global value chains and on core/periphery relationships.
Products and goods used in our everyday lives are sourced from all
over the world. A smart phone, car, or even food sold in the U.S. may have been
handled by hundreds of different countries before they reach our hands today.
Countries have taken advantage of geopolitical factors and economies of scale
to produce an efficient global supply chain. Modern advances in technology have
allowed for more convenient and effective transfers of information and data.
Our day-to-day technology may have simplified nominal tasks such as text
messaging and watching movies, but these products are created through advanced
programming and intellectual property. The real structure of global value
chains is poorly reflected in traditional trade measures because import and
export values do not reveal how much of a product is actually produced within a
country. The evolution of the transnational structure of the world economy
makes it increasingly difficult to accurately measure changes in the structure
of the global system and trends in globalization. Formal network analysis may
help introduce new measures of structural globalization in the world trade
network.
Structural globalization can be defined by the changes in the level of integration (connectedness) of global players in the realms of culture, politics, and economics (Chase-dunn 1999). Cultural globalization refers to the spread of cultural information and tradition. As communications technology advances, it has become easier to communicate and interact in real time with anyone across the globe. These pathways have allowed the spread of culture which include, but are not limited to, music and entertainment, food, memes, video games, dance, and art.
Political globalization refers to the institutionalization of political systems. The United Nations act as a limited global government. The UN security council uses peaceful treaties to help foster military aid and growth. Political policies are taken into consideration when interacting between players. Companies may be able to utilize corporate tax laws in other countries, or invoke protectionist policies which affect relationships in the broader global network.
Economic globalization refers to the relative strength and density of larger versus smaller interaction networks (Chase-Dunn 1999). Economic globalization has traditionally been measured by analyzing a country’s trade openness to the rest of the world. These numbers were derived from data on imports and exports of goods and services, as well as foreign direct investment inflows and outflows. If these numbers were to go up, we can assume that there has been an increase in the volume of interactions between countries, suggesting an upward trend of globalization.
Due to the complexity of the world-system, there are often overlaps in categorizing the different types of globalization. Power attainment in the modern day heavily relies on economic capacity and scale. Global institutions such as the World Bank and the IMF were created to combat some of the economic issues related to global development. These institutions trade economic resources, both physical and intellectual, for forms of political power and control. Cyber security and surveillance capitalism also pose threats to cultural globalization with deep rooted political and economic motivations that should not be ignored. Although we may never completely account for all externalities in types of globalization, categorizing between cultural, political, and economic realms helps to clarify the general focus of the variable.
To build a framework of the world's most developed countries, I chose to study the core countries of the World-Systems theory. In World-Systems theory, countries of the world are categorized into the core, periphery, and the semiperiphery. The core is made up of about twenty countries that were chosen for their dominance in economic, political, and military power in relation to other nations (Kentor 2000). Their dominance on the global field allows them to control and extract resources from the semiperipheral and peripheral countries. For example, the United states exerts their military dominance through multinational peace treaties and security contracts and by controlling 782 military bases all over the world. The U.S. has massive economic dominance in the form of financial markets and the dollar standard; and great political influence over global organizations like the United Nations. The core countries included in this study were: Australia, Austria, Belgium, Canada, Denmark, Finland, France, Germany, Ireland, Italy, Japan, Netherlands, New Zealand, Norway, Portugal, Spain, Sweden, Switzerland, United Kingdom, and the United States of America.
The semiperiphery is composed of countries that are more developed than most of the periphery but are not at the same level of economic, political, and military dominance as the core. Mexico, India, and China are some of the countries that fall into this category. Although countries like India and China compete against advanced economies such as the United States, they have massive populations, much of which are living in poverty. These countries have growing output numbers, but when weighted by their population, they are not as powerful as the core countries.
The periphery consists of all the other countries not categorized in the core and the semiperiphery. They are the least developed countries of the world and typically have little or no economic, political, and military strength on a global scale. The periphery mostly contains countries in Africa, South America, South-East Asia, and the Middle East. The Periphery is dependent on the Semiperiphery and Core for technology and capital. In return, they offer raw materials and cheap labor.
Global players have been shifting between the lines of the core, semi periphery, and periphery throughout all of history, but one of the most notable shifts in the world-system has been the rise of the United States (Chase-Dunn et al 2011). The U.S. had started in the periphery as newly independent colonies trading raw materials and commodities in the global markets. By the end of World War II the U.S. had become the top hegemon. The United States are most notable due to their rapid progression from the periphery to the top of the Core. Power systems often take centuries to move between the hierarchy because most countries remain fairly stable with minor growth over time. There is some upward and downward mobility in this hierarchy but often occurs over long periods of time.
Global Value chains
The current global economy relies heavily on the trade of goods and services across national and geographic barriers. Global value chains allow economies to participate in an efficient trade network by providing developing and low-income countries with information and resources to improve their economic output as well as access to markets outside of their geographic network. Although these networks may help the growth of GDP, they come with social and economic costs and risks.
Low-income countries have high barriers of entry into high income markets such as technology and transportation industries. These industries require high skilled labor and intellectual property that are not attainable to developing nations in the periphery. Countries looking to enter global value chains typically start in markets with low barriers of entry, with the hopes of eventually graduating into more valuable markets.
Previous research on global value chains focuses on specific industries such as textile, transportation, and computer parts. Gereffi analyzes Asian countries' growth through global commodity chains eventually expanding to higher valued chains (Gereffi). Japan had shifted a massive section of their economy to exporting textiles after the world wars. As businesses grew, these companies were able to quickly shift established trade relationships to higher valued goods such as computer chips. Neighboring Asian countries such as South Korea, China, and Taiwan followed after Japan by entering global value chains in low barrier markets such as textiles and expanded into more capital-intensive chains.
Mahutga explains the mobility process in 4 pathways: process upgrading, product upgrading, functional upgrading, inter-sectional or inter-chain upgrading (Mahutga). Process upgrading involves the reorganization of the production process to utilize new and improved technology and methods to increase efficiency. For example, a factory may upgrade assembly line hardware to manufacture products at a faster rate. Product upgrading refers to the production of complex and more sophisticated products. For example, a luggage company may start out producing cheap low-quality bags and eventually upgrade to selling premium luxury bags after experience in the value chain. Functional upgrading refers to the ability to perform new tasks and production capability. An example of functional upgrading would be a company who used to make cell phone screens who are now able to produce cell phone screens, batteries, and memory cards. Eventually the company may be able to produce an entire phone in-house and attain more bargaining power in the global marketplace. Inter-sectional or inter-chain upgrading describes the mobility from one GVC/industry to a higher skilled chain. Countries who started out in textiles and garment industries upgraded into technology and transportation industries with higher skill and capital barriers of entry.
Measuring development and inequality effects of global value chains can be difficult due to their dynamic nature (Mahutga). The study of global value chains requires the observation of specific social data such as the bargaining power and class dynamics that are inherently difficult to measure in quickly changing markets. Generalizations on the effects of GVC participation on development and inequality are hard to make because social dynamics and market conditions shift power balances often. A power unbalance noted at one point in time can quickly shift depending on market demand and political climate.
Theoretically, global value chains disproportionately benefit core-like countries opposed to the periphery. Although low-income countries generally benefit from entry to GVCs, core countries have a greater benefit at the expense of the periphery. As the network increases in size, the bargaining power of the periphery countries decrease. Countries with low bargaining power are met with fierce competition and it becomes harder to move up the chain when the network is growing.
The upgrading processes countries take to increase their standing in the GVC disproportionately harms the working class in these economies (Mahutga). Increasing a country’s output typically comes at the cost of labor rights. As the GVC grows in size, developing and low-income countries have more competition in entry into higher valued chains. Poor countries compete against each other by offering cheaper labor for entry into the value chain, while core-like economies with large amounts of bargaining power benefit from lower cost options.
Attempts to formally measure global value chains through the use of value-added data has been done in recent times but are met with limitations. The fragmentation of the production process makes it difficult to accurately track a country’s economic contribution to the value chain. Value added data for individual counties measures the cost of production within the country subtracting the value of imported inputs. This measure allows for a perspective on globalization trends not captured by traditional data by removing the value created by other countries and isolating domestic activity.
The Organization for Economic Co-operation and Development (OECD) uses Leontief matrices to capture input/output data when compiling their “Trade in Value Added” measure. This measures how much of the trade output in a country was produced domestically.
(UNIDO) categorizes the dollar amount of domestic production within an industry regardless of trade outcome. Some scholars prefer the UNIDO measure when analyzing value added because they are able to isolate specific industries for study. These measures are not as useful when studying on a global scale as input output data are not as easily accessible in all countries. Recent recording of value-added data has been spotty. The OECD only has data until 2015 and UNIDO’s measure is missing many data points after 2015 as well. Currently it is only feasible to conduct studies on GVC in small scale due to the amount of data required to compile value added indicators.
Trade Globalization and Network Analysis
Traditional measures of trade globalization focus on imports, exports, and foreign direct investment (FDI). They analyze weighted averages of country attributes to determine global characteristics. One example of a traditional trade measure is a weighted average of all country trade openness scores determined by the amount of country imports divided by the country’s GDP. In this method, all imports a country receives are added to create an aggregate total.
Network analysis incorporates far more data than traditional measures and allows for a deeper understanding of the global trade network by analyzing the individual trade cases instead of adding all the cases. Network analysis can be used to study a specific country or group of countries in the context of the entire network.
This paper uses import and export data to measure network connectedness and volume of economic trade globalization. This research uses formal network analysis to identify the trend of globalization and investigates the relationship between network connectedness and traditional measures of trade globalization.
Methods
Globalization at its simplest form can be gauged by a country’s connectedness in relation to the whole global network. The trend of globalization can be determined by measuring a country or group of countries’ numbers of connections, where an increase in connection would indicate a more globalized network. Network analysis can be used to measure these connections and visualize the global trade matrix through the use of programming software. By applying formal network analysis to the world trade network, we are able to quantify, not only the degrees of connectedness, but also how centralized or unequal the network is, compared to other networks of the same size. To clarify, I use connectedness as synonymous to network density in that it refers to the number of lines in the network. This is not to be confused with other forms of network connectedness such as Krackhardt’s connectedness which investigates connection to a unitary structure rather than between individual actors. To measure structural globalization, I analyze the network density and links over time to determine if the world and the core are expanding or shrinking.
The UCINet density measure analyzes the average value of ties in an entire network. In order to produce density calculations, the data must be dichotomized. When using binary matrix data, the density measure outputs a number ranging from 0 to 1 and can be interpreted as the probability that any two cases have a tie. To measure world density, I dichotomized world trade data from the IMF Direction of Trade Statistics database. I set the cutting point such that any number of imports or exports greater than 0 is coded as zero and any value greater than zero is coded as 1. So by dichotomizing this way, all the non-zero links are counted. I also dichotomized using higher cutting points to analyze the trend of more significant trade relationships. I set the cut off values to be greater than the mean value of trade as well as a cut off of values greater than one standard deviation. The change in density with higher cutting points eliminates the smaller trade relationships and focuses only on larger trade links. I measured the density values for the world trade network over time, to determine the growth or decline of trade connectedness among countries.
Centrality is a measure used to designate power or influence in a network (Hanneman 2005). There are several forms of centrality measures that serve different purposes but this research focuses primary on degree centrality. Freeman’s degree centrality measure produces two types of calculations: individual country centrality and whole group centralization. A degree is a link between two actors in a network. Degree centrality is ranked by the number of degrees (connections) an actor has with the rest of the network. Freeman’s degree centrality, as well as the density measure, can be interpreted as connectedness because the calculations focus on the number of ties within a network. The density measure only analyses the links in an entire network while degree centrality analyzes links of individual actors as well as the whole network. Freeman’s degree centrality can be used to create a connectedness index of a single, or group, of countries in the trade network.
The whole group centralization measure compares the network to a fully centralized (where one actor holds all the connections) network of the same size. This measure accounts for inequality within the network where a high score indicates a few actors holding most of the possible connections. A smaller centralization score suggests a more even spread of connections where each actor has many connections within the network.
Other forms of centrality exist. Sometimes the most important actors in a network may not have many connections, but are connected to influential people. For example, the president of a country may not interact with a large number of people, but his close circle of advisors may have expansive connections. Degree centrality in this model would not accurately describe the power or influence structure in the network. Other methods of centrality such as closeness centrality and betweenness centrality are available to study different forms of power and influence but this study focuses on degree centrality to measure connectedness in the network.
To understand the trade network, I analyzed export data provided by the IMF on merchandise trade matrices from the years 2005-2019 using Freeman’s degree centrality to determine the core’s connectedness to the rest of the world. I compiled the degree centrality value of each core country and weighed them by their respective population sizes to create an aggregate centrality value for the core. I then graphed the results to track the Core’s connections over time.
Freeman’s centrality measure calculates the “in-centrality” and “out-centrality” of each actor in the trade network. The difference between the two measures depends on the area of the matrix under analysis. For this research in-centrality refers to imports while out-centrality refers to exports. When producing the centrality measures, one half of the matrix (either imports or exports) is isolated to calculate the in or out centrality.
The volume of trade refers to the amount of trade between two countries. The traditional method of globalization is useful to calculate trade volume because it provides the sum of all the trade values. To measure the volume of trade globalization, I used the IMF Direction of Trade Statistics database to track imports over GDP (based on current USD) for the world and the Core. Network analysis can be done to visualize the individual trade relationships that make up the volume of trade.
Data was collected from the International Monetary Fund Direction of Trade Statistics due to their ability to obtain and maintain reliable data on world trade relations. The DOTS contains time series data on the value of merchandise imports and exports according to their partner countries. The DOTS records and updates monthly, quarterly, and annual data on a regular basis from advanced countries and developing/emerging economies. Imports are recorded by cost, insurance, and frigate (CIF), and exports are recorded on a free on board (FOB) basis.
Results
Network Analysis
Network analysis can be useful for visualizing relationships through matrices. Figure 1 shows an example of how network analysis can be used to visualize Core countries and who they trade with. Figure one depicts trade exports between the core and the rest of the world. Diagrams for large networks becoming easily cluttered and it becomes difficult to make out specific trends. Programming software can be used to accurately calculate and analyze these large networks.
Figure
2 depicts the trade network between the Core countries in 2019. Network
analysis can be used to visualize the trade relationship between each country.
Figure 2 contains each core country represented by a node in a circular
pattern. Each node is connected to another node if there exists a trade
relationship between the two countries. The thickness of the line represents
the volume of trade between each country. 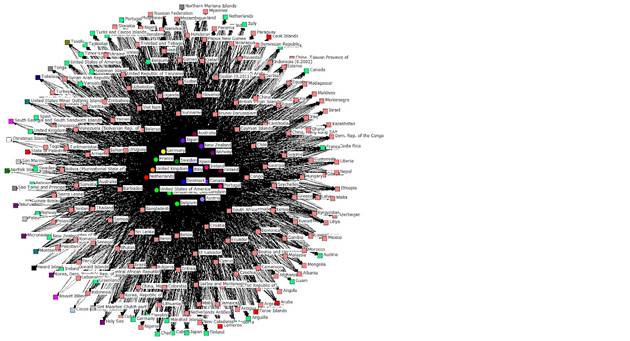
Figure 1: Trade exports between core and the rest of the world Source: IMF Direction of Trade Statistics
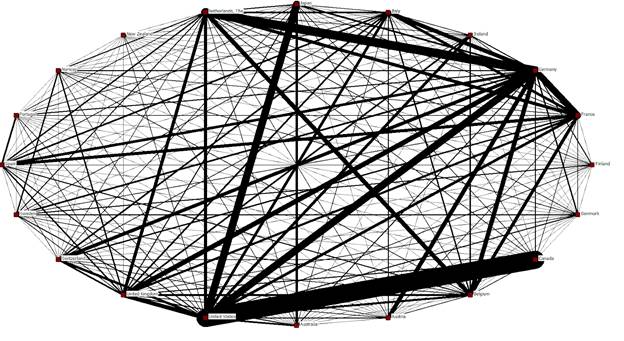
Figure 2: Trade exports within the core Sources:IMF Direction of Trade Statistics
Density of the world trade system can be measured as the ratio of the number of ties extant in a network out of the total number of ties possible. A rise in the density of a network means that there are more connections between the nodes and indicates a positive direction of globalization. Figure 3 shows density in the world trade system tracked over time for 204 countries. Growth in world trade density has slowed down since 2005 and peaked during 2017. Figure 4 tracks the density levels of the world trade network with trade values above the mean. Figure 5 shows the world density of countries with values above one standard deviation from the mean.
Density within the core was expected to remain relatively constant. The core consists of the most developed nations in the world and because the core is always trading with one another, a higher cut off value is needed when dichotomizing the data to isolate significant trade connections over time.
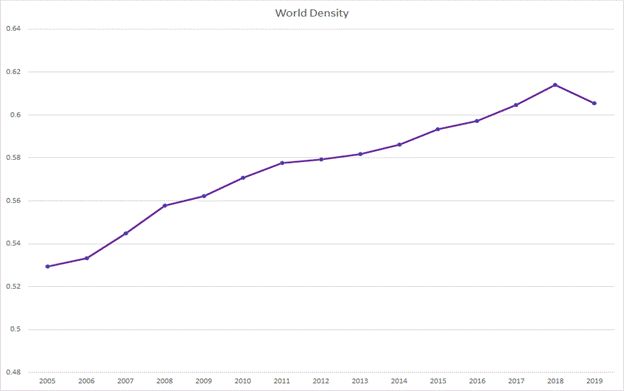
Figure 3 World Density : Source: IMF Direction of Trade Statistics
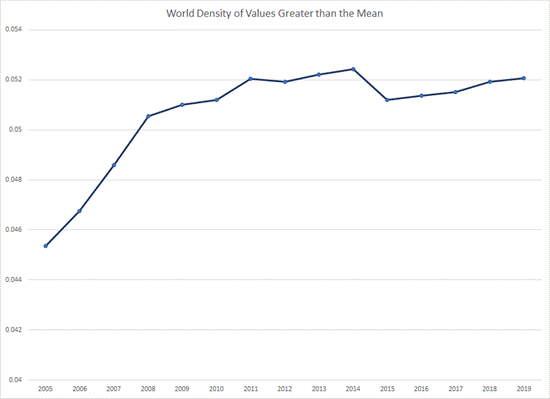
Figure 4 World Density of Values Greater than the Mean Source: IMF Direction of Trade Statistics
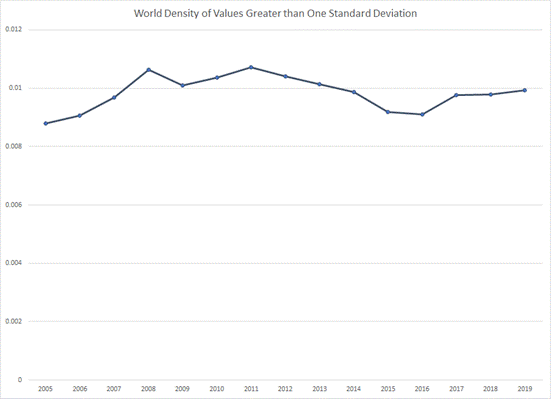
Figure 5 World Density of Values Greater than One Standard Deviation Source: IMF Direction of Trade Statistics
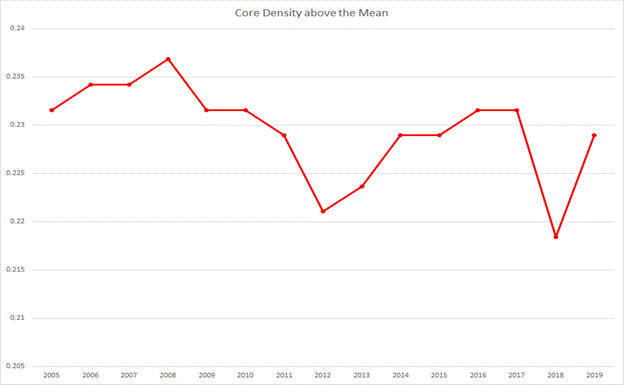
Figure 6 Core density above the mean Source: IMF Direction of Trade Statistics
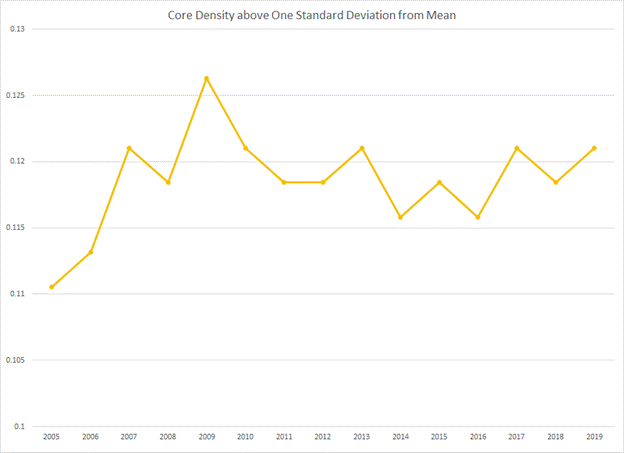
Figure 7 Core density above one standard deviation from the mean Source: IMF Direction of Trade Statistics
Because the
density measure only calculates a total for a square matrix, I used Freeman’s
degree centrality to measure the Core’s connectedness to the rest of the world.
Centrality scores are designated to each country in the network and range from
0 to 1. They represent the number of degrees out of the total number of degrees
possible. Figure 4 tracks the aggregate centrality score for the 20 core
countries. Each core country’s centrality scores were weighed by their respective
population size when creating the aggregate centrality score. 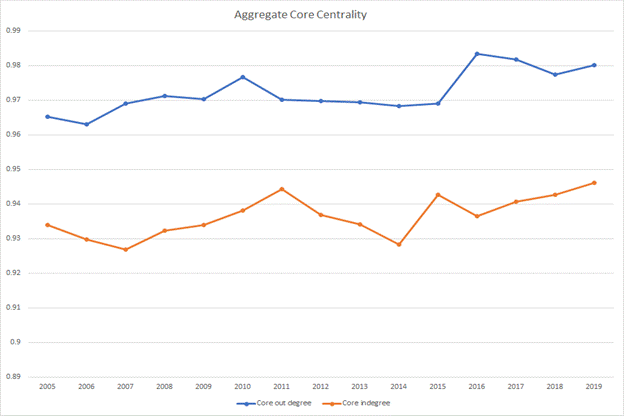
Figure 8 Aggregate Core Centrality can also be interpreted as connectedness. Source: IMF Direction of Trade Statistics
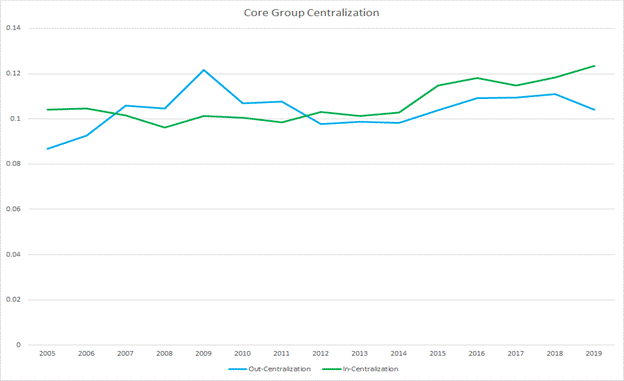
Figure 9 Core group Centralization Source: IMF Direction of Trade Statistics
Traditional World and Core Trade Globalization
Trade volume can be measured by the total amount a country imports in a given year. I used data provided by the International Monetary Fund on “Direction of Trade Statistics.” By tracking imports over time, we can visualize how much each country depends on all the other countries. I analyzed imports as a ratio to GDP to scale for a country’s output. Figure 5 shows World Imports and Exports as a ratio of GDP over time.
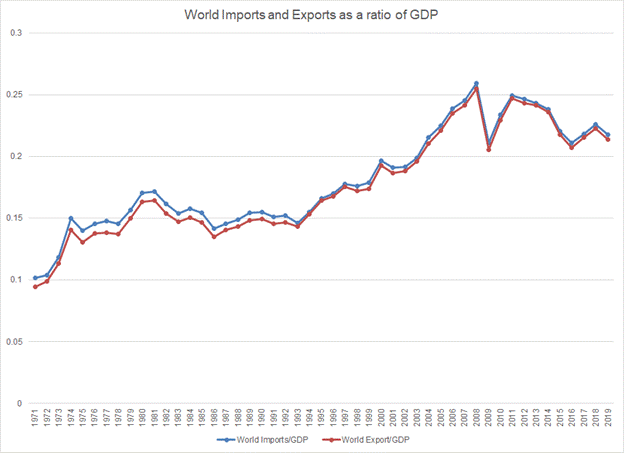
Figure 10 World Imports and Exports as a ratio of GDP (Source: Chase-Dunn, Kim, Alvarez, 2020)
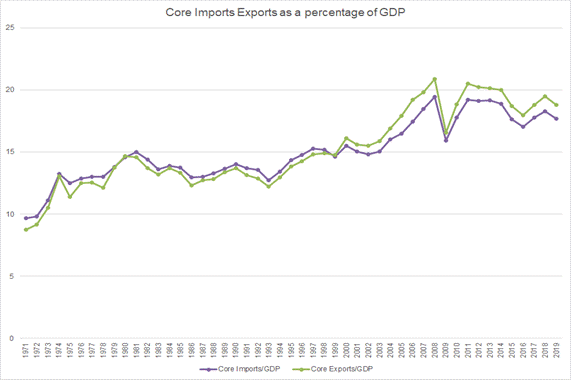
Figure 11 Core Imports and Exports as a percentage of GDP Source: IMF Direction of Trade Statistics
Discussion
World density and Core degree centrality
World density since 2005 has been steadily increasing but is slowing down. When analyzing all values of trade, the world density connections increase until 2018 and begin to decline during 2019 (Figure 3 above). A deeper analysis of trade values above the mean and above one standard deviation from the mean shows that density slows down much earlier (Figures 4 and 5) . Density above the mean peaked during 2014 while density above the standard deviation peaked in 2011. The density measures suggest that there is a ceiling effect occurring in the network where larger valued economies slow down or reduce connections while smaller economies are rapidly expanding their network density.
Density calculations for the Core show that the core has peaked in the number of connections above the mean value of trade in 2008 (Figure 6). Calculations above one standard deviation from the mean show that the core has peaked in significant trade values in 2009 (Figure 7). Trade connections between other core countries have fluctuated on a downward trend since 2008 and 2009 but have not returned to peak levels. Density calculations only look at trade between other core countries.
To track the core’s connectedness to the rest of the world, degree centrality was used to isolate core connections in the world trade system. The Core peaked in connections to the world around 2016 but has seen minor changes overall (Figure 8). Inward and outward centrality both follow similar trends and the core saw a slight decline in the number of connections from around 2010 to 2011. The Core already trades with most of the world and has little room to acquire more connections. They have fluctuated in the connectedness to the world and are expected to maintain most of these connections. These results also indicate that the Core has been slowly reducing the number of connections since 2016 suggesting a trend of deglobalization. The Core experienced loss of trade relationships after the financial crisis of 2008 and have been slowly regaining those trade connections but have not fully restored peak connections.
Core group centralization scores are different from centrality scores. Whole group centralization analyzes and compares the entire network to a fully centralized network of the same size. A fully centralized network is shaped like a star where one actor at the center of the star holds the only connections to all other actors in the network. This is a perfectly unequal network in which all actors in a network only have one connection to the central actor. Whole group centralization scores range from 0 to 1 where the 1 represents the most unequal star network while values closer to 0 have a more even spread of connections within the network. A decreasing trend in centralization scores can be interpreted as increases in trade connection between all countries in the network while an increase in centralization indicates a decline in trade connectedness.
Group centralization in core shows that the core has an extremely diverse network as shown by the low centralization values (figure 9). The core’s in-centralization score, also interpreted as import centralization, has been increasing since 2005. The core’s out-centralization, also interpreted as export centralization, has also increased since 2005 but peaked and declined in 2009. Out-centralization began to increase again around 2012 until 2018. Although export centralization has seen ups and downs it has not reduced further than the lowest value during 2005. Group centralization scores indicate that trade within the core has slightly shifted towards a more unequal network since 2005.
World and Core trade volume
Imports and exports both follow similar trends for both the World and the Core. The volume of trade in the world saw cycles of globalization and deglobalization from the 1970s to the 1990s. From around 1993 the world experienced a great rise in the volume of trade leading up the great recession in 2008. Since the financial crisis the world has experienced short cycles of globalization on a decreasing trend.
Trade volume in the Core has been slowly declining since 2011. Although the Core has maintained network density, they have been slowly reducing their volume of trade. Although there is an overall upward trend in the volume of trade since the 1970s, the recent years have experienced ups and downs that make it more difficult to predict the direction of globalization.
These findings indicate that in the most recent years, both the World and the Core have likely shifted towards a trend of deglobalization but it is not clear if it will continue to decline or fluctuate as it has been doing for the past few years. Recent events suggest that the world will continue towards deglobalization as Covid-19 debilitates national economies and slows down growth for the foreseeable future but the wave of deglobalization seems to have begun before the arrival of the pandemic.
Limitations
Globalization indicators are inherently hard to measure. When accounting for factors such as network connectedness and volume of trade, there may be contradiction in the direction of globalization. If a country is expanding the amount of connection it has to other countries, we would call that globalization. If a country were to expand the volume of imports and exports to the rest of the world, it would also suggest globalization. But if a country were to increase their connections, yet decrease the volume of trade, the trend in globalization becomes ambiguous. These conditions could be transitory states or the inflection point between globalization and deglobalization but more research needs to be conducted to examine the significance of ambiguous globalization cases.
In a perfect world all data points would be recorded and accurate, unfortunately, factors such as error, non-compliance, and attrition may lead to gaps in the available data. Institutions such as the IMF, UNCTAD, and World Bank are growing in their reliability and consistency in measurement, but they are not perfect.
There are many aspects of globalization that cannot be measured due to their inherent nature. Data on world trade does not include underground and illegal markets that operate on a global scale. Although these operations are irrelevant for accounting purposes, they do hold potential impact on cultural and political globalization.
Fragmentation of the production process also muddies data on imports and exports. The final product sold by one country may have involved hundreds of other economies that are not reflected in the final data. As global supply and value chains become increasingly more complex, it becomes harder to rely on the traditional measures of globalization. Despite new methods to trace and analyze the current trade networks, it is not possible to make historical comparisons without more detailed accounts of the past.
The OECD and the UNIDO (United Nations Industrial Development Organization) have created value added indicators through the use of global input-output matrices. However, there has not been enough data recorded to create a comprehensive model of value chains. The OECD only provides data until 2015 and UNIDO estimates provide little information on value added after 2015 (Chase-Dunn, Kim, Alvarez 2020). The lack of availability in data prevents the ability to conduct a comprehensive historical analysis of global value chains at this time.
Implications
The efficiency of the global supply chain also leaves it vulnerable to shocks and threats against the system. With the global pandemic caused by Covid-19, the global supply chain came to a halt. Production delays in one area slows down the entire production process. As different countries are affected at different timelines, production and transportation has been extremely unpredictable. Unexpected outbreaks and second waves of infections make production inconsistent and pose threats to human lives in the process.
Deglobalization may pose threats to the core-periphery relationship with potentially negative effects on development. But earlier waves of deglobalization may have provided opportunities for some countries seeking to move up in the global hierarchy. Global value chains have been crucial to the rise in growth rates since the 1990s (OECD 2005) and developing countries without access to these markets will struggle due to their lack of diversity in outputs. This is especially true for oil dependent economies. As the price of oil drops, these economies need to pivot to different industries to support growth. Without access to global supply chains, economies would have the difficult task of producing all components domestically.
This review of globalization only investigates a portion of economic globalization. Traditional trade measures typically include foreign direct investment (FDI) flows to track capital movements across borders. Research has shown that international investment flows may have also entered a phase of deglobalization as FDI experienced great reductions in value during the late 1990’s, 2007, and 2018 (Chase-Dunn, Kim, Alvarez 2020).
Formal network analysis as well as traditional trade measurements indicate that the world has slowed down and decreased connectedness and volume of trade. A deeper analysis into the core countries show that they have behaved similarly to the rest of the world, but have peaked and declined at an earlier time. This study finds evidence for trade deglobalization, but other types of cultural, communications, and political connectedness may have a different trajectory.
Bibliography
Bos, Mathia (eds.?) Borderlines in a Globalized World: New Perspective in a Sociology of the World-System. Dordrecht, Netherlands: Kluwer
Brady, David & Beckfield, Jason & Zhao, Wei. (2007). The Consequences of Economic Globalization for Affluent Democracies. Annual Review of Sociology. 33. 10.1146/annurev.soc.33.040406.131636.
Chase-Dunn, Christopher "Globalization: a world-systems perspective," Journal of World-Systems Research 5,2, 1999. Reprinted in Gerhard Preyer and Mathias Bos (eds.) Borderlines in a Globalized World: New Perspective in a Sociology of the World-System. Dordrecht, Netherlands: Kluwer.
Chase-Dunn, Christopher, Yukio Kawano and Benjamin Brewer 2000 "Trade Globalization since 1795: waves of integration in the world-system," American Sociological Review 65, 1: 77-95. https://wsarch.ucr.edu/archive/papers/c-d&hall/isa99b/isa99b.htm
Chase-Dunn, Chris, Roy Kwon, Kirk Lawrence and Hiroko Inoue 2011 “Last of the hegemons: U.S. decline and global governance” International Review of Modern Sociology 37,1: 1-29 (Spring)
Chase-Dunn, Christopher, Jisoo Kim and Alexis Alvarez 2020 “Comparing Waves of Structural Deglobalization: A World-Systems Perspective” Presented at the virtual meeting of the California Sociological Association, Nov. 6-7. IROWS Working Paper #137 available at https://irows.ucr.edu/papers/irows137/irows137.htm
Gereffi, G., Humphrey, J., & Sturgeon, T. (2005). The Governance of Global Value Chains. Review of International Political Economy, 12(1), 78-104. Retrieved March 5, 2021, from http://www.jstor.org/stable/25124009
Hanneman, Robert A. and Mark Riddle. 2005. Introduction to social network methods. Riverside, CA: University of California, Riverside ( published in digital form at http://faculty.ucr.edu/~hanneman/ )
Kentor, Jeffrey. 2000. Capital and Coercion: The Role of Economic and Military Power in the World-Economy 1800-1990. New York: Routledge.
Mahutga, Matthew C. 2012. “When Do Value Chains Go Global? A Theory of the Spatialization of Value Chain Linkages.” Global Networks 12(1):1–21
OECD, ”Measuring Globalisation: OECD Economic Globalisation Indicators 2005” 2005, OECD
Shannon. R Thomas, Introduction to the World-Systems Perspective1996. Westview Press