“When north-south relations were east-west:
urban and empire synchrony (500 BCE-1500 CE)”
Christopher
Chase-Dunn, Richard Niemeyer, Alexis Alvarez,
Hiroko
Inoue, Kirk Lawrence and Anders Carlson
Institute for
Research on World-Systems
University of California-Riverside
(v. 3-19-06)
Frederic Teggart’s
Earlier studies have demonstrated a curious interregional synchrony
in the growth and decline of large cities and empires. From about 500 BCE until
about 1500 CE cities and empires in East Asia and the West Asian/Mediterranean
region were growing and declining in the same periods, whereas intervening
To be presented at the 2006 conference
of the International Studies Association, San Diego, March 23, 3:45-5:30 PANEL: The Historical Long-Term. 5006
words
This
paper is available at https://irows.ucr.edu/papers/irows16/irows16.htm
The growth and decline patterns of the world’s largest cities and
empires and their changing locations over the past three millennia provide an
important window on world history. Earlier research has repeatedly demonstrated
a fascinating synchrony in the growth/decline phases of largest cities and
empires in East Asia and the West Asian/Mediterranean region (e.g. Chase-Dunn and Willard 1993; Chase-Dunn,
Manning and Hall 2000; Chase-Dunn and Manning 2002).
Using
data on the population sizes of largest cities and the territorial sizes of
largest empires it has been discovered and repeatedly confirmed that
medium-term growth/decline phases in
Earlier Findings
The population and areal sizes of
human settlements have increased since the emergence of sedentism around 12,000
years ago, and so have the sizes of the largest polities. But these general
long-term trends have been complicated by sequential middle-term declines in
the sizes of the largest cities and empires in all regions where urban and polity
sizes have been studied quantitatively. The population size estimates of both
modern and ancient cities are subject to large errors, and existing
compilations (Chandler 1987; Modelski 2003) badly need to be improved using
better methods of estimation (e.g. Pasciuti and Chase-Dunn 2002). The same can
be said for existing compilations of estimates of the territorial sizes of the
world’s largest empires (Taagepera 1978a, 1978b, 1979, 1997). When these
upgraded estimates become available, the East/West synchrony findings discussed
here will need to be reexamined with the improved data. We believe that the
East/West synchrony finding will be confirmed.
This phenomenon of East/West urban
and empire synchrony in middle-term growth/decline phases has been subjected to
several different methods of analysis, and it holds up across all of them. Both
changes in the size of the largest cities and changes in the steepness of the
city-size distributions have been used. And earlier studies have used two
different kinds of spatial units of analysis: constant regions and expanding
political-military networks (interaction networks of fighting and allying
states). The East/West synchrony has been found with both.
Detrending
is important because the long-term trend for city and empires sizes to increase.
Two different methods of detrending have been used: partial correlation
controlling for year and decadal change scores in which the earlier year is
subtracted from the later year. In the studies of empire sizes, empires that touch
adjacent macro-regions such as the Mongol Empire of the thirteenth century CE
have been removed from the analysis because they build in a degree of synchrony
by appearing in both regions at the same time. The synchrony finding is strong
even when this case has been removed from the calculations.
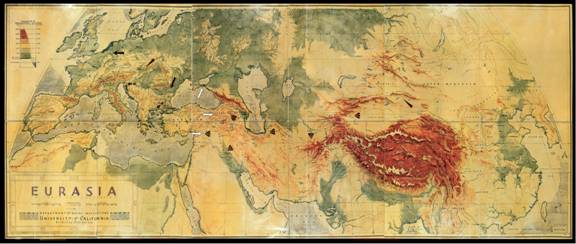
Frederick
Teggart’s (1939) path-breaking world historical study of temporal
correlations between events on the edges of the Roman and Han Empires argued
the thesis that incursions by Central Asian steppe nomads were the key to
East/West synchrony. An early study of city-size distributions in Afroeurasia
(Chase-Dunn and Willard 1993; see also Chase-Dunn and Hall 1997: 222-223) found
an apparent synchrony between changes in city size distributions and the growth
of largest cities in
 Figure 1: Sizes of Largest cities in
Comparable
other instances of distant systems that came into weak contact with one another
can be found. Within the Old World, the Mesopotamian and Egyptian core
regions were interacting with one another by means of prestige goods exchange
from about 3000 BCE until their political-military networks (state systems)
merged in 1500 BCE. Chase-Dunn, Pasciuti, Alvarez and Hall (2006) have already
examined this case for synchrony and have not found it, though the data on
Bronze Age city and empire sizes are very crude with regard to temporality and
accuracy. It is also possible to study the temporality of rise and fall and
oscillations among distant regions in the
Chase-Dunn,
Alvarez and Pasciuti (2005) also report detrended correlations between constant
regions for total population estimates taken from McEvedy and Jones
(1975). These total population estimates at 100-year intervals show rather high
growth/decline synchronies for several regions, also noted and discussed by
McEvedy and Jones (1975: 343-48).
The
East/West growth/decline synchrony seems to be rather robust, though better
estimates and finer temporal resolution of empire and city sizes might
challenge it. Interregional synchrony can be caused when two cyclical processes
get simultaneously reset, either by the same cause or by different causes. This
could be a one-shot occurrence. Or a process that is similarly cyclical can
cause synchrony. Candidates for the East/West synchrony are: climate change,
epidemic diseases, trade interruptions, or attacks by
Possible Explanations
Climate
change might affect regions by causing growth and decline of agricultural productivity
that in turn affects cities and empires. Perhaps because
But
climate change could also be involved in somewhat more complicated ways.
Central Asian steppe nomads (discussed below) were very susceptible to climate
change because their pastoral economy was greatly affected by changes in
temperature and rainfall. It is possible that climate change in
The
above hypotheses all conceive of climate change as an exogenous variable. But
it is also possible that city and empire growth change the climate. We know
that population growth and the development of complex civilizations changes the
environment by means of deforestation, soil erosion and the construction of
large irrigation systems (Diamond 2005). These changes may have affects on
climate. Modern studies show that the construction of large cities creates an
“urban heat island” that changes the environment in the immediate vicinity and
downwind of cities. Cities ingest and egest water, air and energy, and while
industrial cities do this on a much larger scale, earlier large cities also did
it to some extent. So large-scale agriculture and city-building may be causes
of climate change. Thus climate change may also be an endogenous variable.
We
know that Central Asian steppe nomads who raised horses and sheep periodically
formed large confederacies and attacked the agrarian empires of the East and
the West (Barfield 1989). Famous examples are the Huns and the Mongols. Perhaps
there was a cycle of Central Asian incursions that impacted upon the agrarian
civilizations of the East and the West and that accounts for the synchrony.
We
know that epidemic diseases spread across
We
also know that the Roman and Han empires were linked by long distance trade
routes across the Silk Roads and by sea. Perhaps interruptions to trade, or
periods of greater and easier trade flows, affected the Eastern and Western
civilizations simultaneously.
It
is also possible that two systems that are cycling independently can become
synchronized if they are both reset by a simultaneous accidental shock. This is
the so-called “Moran Effect” known in population ecology. We have discussed
this possibility in Chase-Dunn, Alvarez and Pasciuti (2006).
Figure
2 is a propositional inventory that includes most of the possible causes of
East/West synchrony.
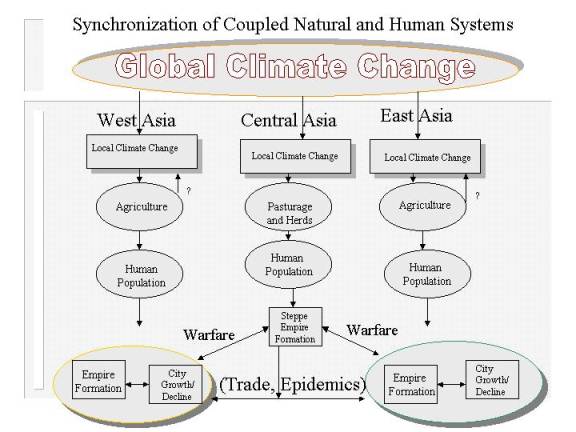
Figure 2: Possible Causes of East/West Synchrony
More
research is required to find out which of these possible causes was responsible
for the East/West synchrony. We have found some evidence that temperature
changes in
East Asian Climate Change and Growth/Decline
Phases
We
have located time series data on two indicators of climate change in
The
first indicator we have of climate change from China is an estimate of changes in average temperature that are inferred from
measurements taken of stalagmites formed in the Shihua cave near Beijing (Tan et
al 2003).[2] Ideally
the indicator of climate change should be geographically near the area of city
and empire growth. Recent research on El Nino and the Southern Ocean
Oscillation shows that climate dynamics on a global scale are linked by huge
inter-regional “teleconnections” in which changes in ocean temperature in one
region affect rainfall and temperature in distant other regions, but the
resulting patterns are very different from region to region (Davis 2001). This
means that we need to have information on climate change that is spatially near
to the areas where we are studying the possible impacts. Knowing what happened
in Greenland or
The
estimated temperature series as well as the plots for largest city and largest
polity from 650 BCE to 1800 CE are shown in Figure 3.
Figure 3: Temperature Change (
Figure 3 graphs the temperature changes inferred
from
Table 1 reveals a significantly steady rate of
empire growth throughout the period, when plotted against DECADE (correlation
is 0.587, p < 0.01). Similarly, the
population of the largest city in
Table 1: Bivariate
and partial correlations: largest city, largest empire, temperature estimate
from
Table 1 also confirms an earlier finding of a
significant bivariate and partial temporal correlation between city and empire
sizes in
The results in Figure 1 and Table 1 are based on only 26
time points because of the paucity of data on city population sizes, which have
been estimated at only very widely-spaced intervals, especially for the earlier
time periods. When we examine the relationship between empire sizes and
temperature change separately we have far better temporal resolution. Figure 4
graphs the empire sizes using ten-year interpolated values and the ten-year
moving average of yearly temperature estimates. The bivariate correlation is
.02.
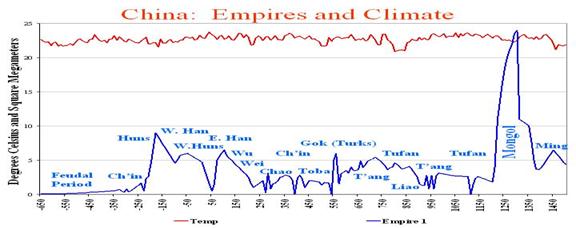
Figure 4: Largest Empire and Temperature Change in
Figure 5 shows the same
relationship, but it is easier to see what is going on because the scores have
been standardized.
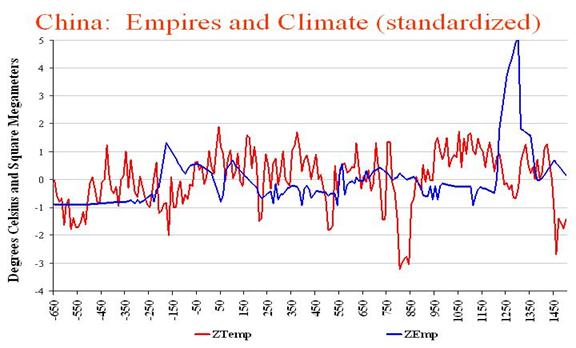
Figure 5: East Asian Largest Empires and Average
Temperatures (standardized values)
Figure 6 depicts the relationship between
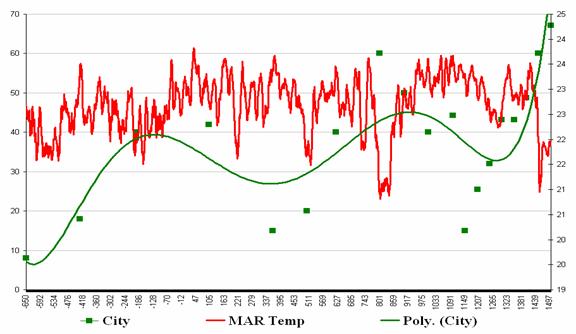
Figure 6: Largest Cities and Average Temperature with city
polynomial
The
results so far imply that there is no regular relationship between climate
change and the growth/decline phases of cities and empires in
Also
temperature is only one indicator of climate change. Yearly rainfall, the
distribution of rainfall throughout a year, the frequency of large and
destructive storms – all these are important aspects of climate change that may
have large effects on agriculture and irrigation systems but are not well
reflected in temperature changes. It is also possible that climate change near
We also want to examine the possibility of time lags
between climate change and city and empire growth decline phases. The methods
employed above presume a simultaneous causality, whereas it is likely that
changes in climate take some period of time to affect the sizes of cities and
empires. This can be systematically examined using the techniques employed by
Turchin and Korotayev (nd) for studying lagged dynamical relations among time
series variables. We plan to do this in the next version of our research.
Understanding
Climate Oscillations in the
Much
of the climate change within
the Mediterranean region is a product of the North Atlantic Oscillation (NAO),
a hemispheric meridional oscillation in atmospheric mass between the polar
regions near
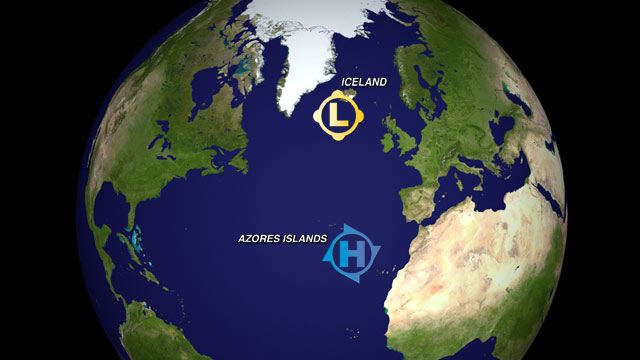
Figure 7: Atmospheric
regions responsible for North Atlantic Oscillation
http://sciencebulletins.amnh.org/earth/f/nao.20040910/essays/28_1.php
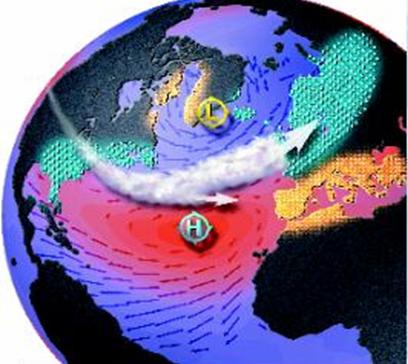
Figure 8: Atmospheric effects and climate results of
the NAO positive phase.
http://www.ldeo.columbia.edu/~visbeck/nao/presentation/html/NAO.htm
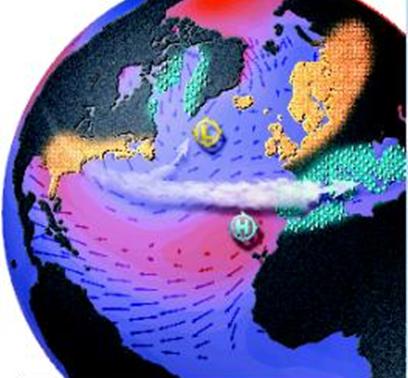
Figure 9: Atmospheric
effects and climate results of the NAO negative phase
http://www.ldeo.columbia.edu/~visbeck/nao/presentation/html/NAO.htm
Climate conditions within
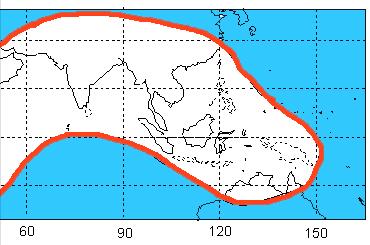
Figure 10. Regions affected by the Asian Monsoon
http://daac.gsfc.nasa.gov/atmosphere/dynamics/images/monsoon.qt
Connections
between the NAO and the Asian Monsoon
Recent research has
supposedly established a synchronic connection between regions affected by the
NAO and regions affected by the Asian Monsoon (Wang et al. 2005). Generally speaking, many of the abrupt
climate change events in the paleoclimatology record of the Asian Monsoon
correlate with abrupt climate change in the Mediterranean and

Figure 11:
Comparison of the smoothed (5-point running average) detrended China climate
proxy data (green) with the smoothed 20-year averaged Greenland climate proxy
record (5-point running average, red) over the past 9000 years. The broad
correlations between the
From Wang et al. 2005, http://www.sciencemag.org/cgi/content/full/308/5723/854
Comparison of
Mediterranean and
Figure 12: Geographic
locations of proxy measures for climate conditions
In order to further examine the hypothesis of
East/West climate synchrony we compared proxy precipitation data from the Red
Sea (Lamey et al. 2006) with
Contrary to the previous research cited above, a
positive correlation between
Figure
13: East/West Estimated Precipitation Oscillations (Sources: Wang et al 2005
and Lamey et al 2006)
With regard to the correlation between the precipitation estimates
from
Figure 14: East Asian
Precipitation and Temperature
The relationship between the
Figure
15:
At
this point we are lacking firm conclusions. There do not appear to be big
climate events in either East or
Bibliography
Alvarez, Alexis 2003
“Cycles of primacy in Afroeurasia: 200-1850 CE” Department of
Sociology,
University of California, Riverside http://home.earthlink.net/~alexisalvarez/propaper.htm
Bairoch, Paul 1988 Cities
and Economic Development: From the Dawn of History to the Present.
Barfield, Thomas J. 1989 The
Perilous Frontier: Nomadic Empires and
Barnes,
Ian, and Robert Hudson. 1998. The History Atlas of
Boyle, Peter. 1977. The
Mongol World Empire, 1206 – 1370.
Chase-Dunn, Christopher
and Alice Willard, 1993 "Systems of
cities and world-systems: settlement size hierarchies and cycles of political
centralization, 2000 BC-1988AD" A paper presented at the International
Studies Association meeting, March 24-27,
Chase-Dunn, Christopher,
Susan Manning and Thomas D. Hall, 2000 "Rise
and Fall: East-West Synchronicity and Indic Exceptionalism Reexamined"
Social Science History 24,4: 721-48(Winter) .
Chase-Dunn, Christopher
and Susan Manning, 2002 "City systems and
world-systems: four millennia of city growth and decline," Cross-Cultural
Research 36, 4: 379-398 (November).
Chase-Dunn, Christopher
Alexis Alvarez, and Daniel Pasciuti 2005 "Power and
Size; urbanization and empire formation in world-systems" Pp. 92-113
in C. Chase-Dunn and E.N. Anderson (eds.) The Historical Evolution of
World-Systems.
Chase-Dunn, Christopher ,
Alexis Alvarez and Daniel Pasciuti, 2005 “World-systems in the
biogeosphere: three thousand years of urbanization, empire formation and
climate change.” Pp. 311-332 in Paul Ciccantell, David A. Smith and Gay Seidman
(eds.) Nature, Raw Materials, and Political Economy.
Chase-Dunn, Christopher,
Daniel Pasciuti, Alexis Alvarez and Thomas D. Hall 2006 “Growth/decline phases
and semiperipheral development in the ancient Mesopotamian and Egyptian
world-systems” Pp. 114-138 in Barry K. Gills and William R. Thompson (eds.) Globalization and Global History.
Chase-Dunn, Christopher
and Thomas D. Hall Forthcoming “Global social change in
the long run” in C. Chase-Dunn and Salvatore Babones (eds.) Global
Social Change.
Christian, David 2004 Maps
of Time.
Cioffi-Revilla, Claudio and David Lai 2001 “Chinese Warfare and Politics in the Ancient East Asian International System, ca. 2700 B.C. to 722 B.C.” International Interactions 26,4: 1-32.
Diamond, Jared 2005 Collapse.
Fagan, Brian 1999 Floods,
Famines and Emperors: El Nino and the Fate of Civilizations.
Basic Books.
Friedman, Jonathan and
Christopher Chase-Dunn 2005 Hegemonic Declines: Past and Present.
Gong, Gaofa and Sultan Hameed 1991 “The variation of moisture conditions in China
Lattimore, Owen 1940
Inner Asian Frontiers of
Haywood, John. 1998. Historical Atlas of the Ancient World. Oxforshire, OX: Andromeda Oxford Ltd.
_______
1998. Historical Atlas of the
Classical World. Oxforshire,
OX: Andromeda Oxford Ltd..
_______
1998. Historical Atlas of the
Medieval World. Oxforshire, OX: Andromeda Oxford Ltd..
_______
1998. Historical Atlas of the
Modern World. Oxforshire, OX: Andromeda Oxford Ltd.
Kradin, Nikolay N.. 2002.
“Nomadism, Evolution and World-Systems:
Pastoral Societies in Theories of Historical Development.” Journal of
World-Systems Research, 8,3.
Lamey, Frank, Helge W. Arz, Gerard C. Bond, Andre
Bahr, and Jurgen Patzold. (2006) Multicentennial-scale hydrological changes in
the Black Sea and northern Red Sea during the Holocene and the Artic/North
Atlantic Oscillation Paleoceanography, 21,
PA 1008
Lee, J. S. 1931. “The Periodic Recurrence of Internecine
Wars in
Lee, J. S. (1933) in Studies Presented to Ts’ai Yuan P’ei on His Sixty-fifth Birthday Part I, ed. Fellows and Assistants of the Institute of History and Philology (Institute of History and Philology, Taipei), pp. 157-166.
McEvedy, Colin and
Richard Jones 1975 Atlas of World Population History.
Penguin.
McNeill, William H. 1976 Plagues
and
McNeill, John R. and
William H. McNeill 2003 The Human Web.
Modelski, G. (2003).
World cities: -3000 to 2000.
Modelski, George “Evolutionary World Politics” web site http://faculty.washington.edu/modelski/worldcities.html
Pasciuti, Daniel and Christopher Chase-Dunn 2002 “Estimating the population sizes of
cities.” https://irows.ucr.edu/research/citemp/estcit/estcit.htm
Peregrine,
Peter N. 2005 “Synchrony in the new world: an example of archaeoethnology”
Paper presented at the annual meeting of the Society for Crosscultural
Research, February 23-27, Santa Fe, New Mexico.
Taagepera,
Rein 1978a "Size and duration of empires: systematics of size"
Social Science Research 7:108-27.
______
1978b "Size and duration of empires: growth-decline curves, 3000 to 600
B.C." Social Science Research, 7 :180-96.
______1979
"Size and duration of empires: growth-decline curves, 600 B.C. to 600
A.D." Social Science History 3,3-4:115-38.
_______1997
“Expansion and contraction patterns of large polities: context for
Tan,
Ming, Tungsheng Liu, Juzhi Hou, Xiaoguang Qin, Hucai Zhang and Tieying Li 2003
“Cyclic
rapid warming on centennial-scale revealed by a 2650-year stalagmite record of
warm season temperature” Geophysical Research
Letters Vol. 30, No. 12, 1617 (June). http://wdc.cricyt.edu.ar/paleo/pubs/tan2003/tan2003.html
Teggart,
Frederick J. 1939
Turchin,
Peter and Thomas D. Hall 2003 “Spatial synchrony among and within
world-systems: insights from theoretical ecology.” Journal of World-Systems Research 9,1:
37-64.
Turchin,
Peter and Andrey Korotayev n.d. “Population dynamics and internal warfare: a
reconsideration”
http://eclectic.ss.uci.edu/~drwhite/Global/Turchin-Korotayev-plus.pd
Quansheng Ge, Jingyun
Zheng, Xiuqi Fang*, Xueqin Zhang, Piyuan Zhang, Zhimin Man, and
Wei-Chyung Wang “Winter half-year temperature reconstruction for the middle and
lower reaches of the Yellow River and Yangtze River, China, during the past
2000 years.” Holocene 13, 6:933-940, 2003
http://www.ngdc.noaa.gov/paleo/pubs/ge2003/ge2003.htmlWang, Shaowu and Wei-Chyung Wang 1994 “Application of historical documentary records in resonstruction of the paleo-climate series in China
Wang, Yongjin, Hai Cheng, R. Lawrence Edwards,
Yaoqi He, Xinggong Kong, Zhisheng An, Jiangying Wu, Megan J. Kelly, Carolyn A.
Dykoski, Xiangdond Li. The Holocene
Asian Monsoon: Links to Solar Changes and
Wu, Xiangding 1994 “Tree-ring chronologies and their response to climate in the Qinling mountains, China Yang, B., Braeuning, A., Johnson, K.R., and Yafeng, S., 2002,“General characteristics of temperature variation in China http://www.ngdc.noaa.gov/paleo/pubs/yang2002/yang2002.html
Zhang, Jiacheng and
Thomas J. Crowley 1989 “Historical climate records in China and reconstruction
of past climates” Journal of Climate 2,8: 833-849.
Zhu, Kezhen (Chu,
K.) 1973 "A preliminary study on the climatic fluctuations during the last
5000 years in