Upsweep Inventory:
Scale Shifts of Settlements and Polities Since the Bronze Age
Alexis Álvarez, Hiroko Inoue, Kirk Lawrence, James Love,
Evelyn Courtney and Christopher Chase-Dunn
Institute for Research on World-Systems
University of California-Riverside
v. 8-4-10, 8487 words
This research was supported by National Science Foundation Grant #: NSF-HSD SES-0527720
Thanks to Peter Turchin, Richard Niemeyer and Oswin Chan for help with this research.
This paper reports results from a research project that studies the growth/decline phases of settlements and polities since the Stone Age.[1] The project uses both quantitative estimates of population sizes of the largest settlements in regions as well as estimates of the territorial sizes of largest polities to study changes in the scale of human institutions. Here we report the results of an inventory of upward sweeps. Upward sweeps are defined as instances in which the largest settlement or polity in a designated region significantly increases in size for the first time. We use world-systems rather than single polities as the unit of analysis. World-systems are defined as being composed of those human settlements and polities within a region that are importantly interacting with one another (Chase-Dunn and Hall 1997). Our project would like to include all the local, regional and intercontinental networks, including both nomadic and sedentary world-systems, though in practice we are limited by the availability of quantitative estimates of largest polity and settlements sizes.
Cycles, Upward Sweeps, Collapses and Ceilings
Our project compares relatively small regional world-systems with larger continental and global systems. Thus we must abstract from scale in order to examine changes in the structural patterns of small, medium and large human interaction networks. In this article we focus on medium term change in the scale of polities and settlements.[2] In the long run settlements and polities have tended to get larger, but our research focuses on medium-term sequences of growth and decline in order to identify those upward sweeps in which the scale significantly changed. Identification of these events will facilitate our understanding of socio-cultural evolution because these are the events that account for the long-run trend toward larger and more complex human social institutions.
When we use world-systems --an interacting set of polities and settlements-- as the unit of analysis nearly all systems oscillate in what we may term a normal cycle of growth and decline. The largest city or polity in each region reaches a peak and then declines and then this or another city or polity returns to the peak again. These cycles are usually not observed by looking at a single polity or settlement in isolation, but rather by looking at the largest settlements and polities within a region of interaction. We call this a “normal cycle of growth and decline.” It roughly approximates a sine wave, although few cycles that involve the behavior of groups of humans actually display the perfect regularity of amplitude and period found in the pure sine wave.
In Figure 1 the normal cycle of growth and decline is half way down the figure and is labeled “normal growth and decline.” At the top of Figure 1 is a depiction of an upward sweep in which the size of the largest entity (polity or settlement) increases by a factor of 2. Such a sweep may be relatively rapid or may be slow, and Rein Taagepera (1978a) observes that the speed of the growth phase is often related to the sustainability of the upsweep, at least in the case of empires. Taagepera notices that empires, such as the Roman, that rise more slowly tend to last longer than those that rise abruptly (such as the Mongol). When an upward movement is sustained and a higher level of scale becomes the norm we call this an “upward sweep” or an “upsweep.” An upsweep goes to a peak that is more than 1/3 higher than the earlier peak. We distinguish between an “upcycle,” which is the normal upturn in a growth/decline cycle, and an upsweep, which goes to a level that is more than 1/3 higher than the earlier peak. When an upsweep is temporary and returns to the old lower norm we call it a “surge” (see the 2nd line from the top in Figure 1). We also distinguish between three types of decline, a “normal” decline which is part of the normal growth and decline cycle, a short-term collapse in which a decline goes significantly below what had been established as the normal trough, and a sustained collapse in which the new lower scale becomes the norm for some extended period of time.
Jared Diamond (2005) has discussed the factors that cause collapses, though he does not employ quantitative indicators of collapse and he often focuses on a single polity that collapsed while ignoring neighboring polities that did not collapse. If intersocietal interaction networks (world-systems) had been his unit of study instead of single polities most of the cases he studied would be seen to have been instances of what we are calling normal rise and fall cycles rather than instances of system-wide collapse. A genuine system collapse is when all the polities in a region go down and stay down for at least two average cyclical periods.
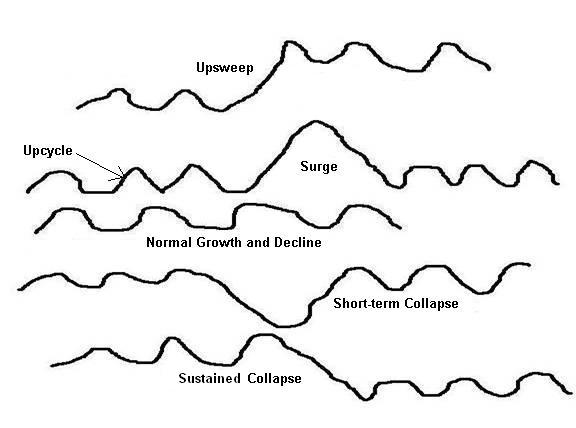
Figure 1: Types of medium-term scale change in the largest settlement or polity in an interacting region
This article reports the results of an inventory of all the instances of the types of scale change of settlement population sizes and the territorial sizes of polities for the world regions for which we currently have quantitative data. We will use this inventory to identify instances of each type of change, and eventually will use these as cases for testing hypotheses about the causes of upsweeps. We also use our counts of cycles and upsweeps to compare regions to see if there are similarities or differences in terms of the numbers of cycles and upsweeps over time. This paper reports results for all regions for which we currently have adequate data, except for the U.S. Southwest.[3]
Figure 2 is a stylized depiction of the rise and fall of large polities and occasional upward sweeps that portrays, not the history of a single world region, but rather the general evolution of what has happened over the past 12,000 years as many small polities (bands, tribes and chiefdoms) have been consolidated into a much smaller number of larger polities (states, empires and a possible future world state).
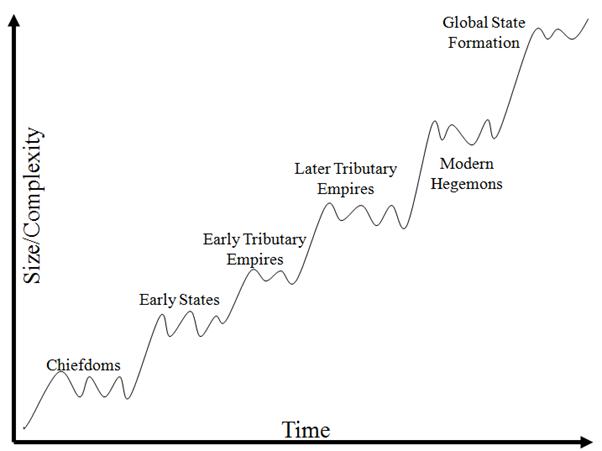
Figure 2: Rise, Decline and Upward Sweeps of Polity Size
George Modelski’s (2003) recent study of the growth of cities over the past 5000 years points to a phenomenon also noticed and theorized by Roland Fletcher (1995) – cities grow and decline in size, but occasionally a single new city will attain a size that is much larger than any earlier city, and then other cities catch up with that new scale, but do not much exceed it. It is as if cities reach a size ceiling that it is not possible to exceed until new conditions are met that allow for that ceiling to be breached. This notion of size ceiling will also be useful for studying changes in the sizes of polities.
Theories of Rise-Decline Cycles and Upward Sweeps
There are many theories about why systems of interacting polities experience cycles of rise and fall. A thorough overview of the anthropological literature on “cycling” – the rise and fall of large chiefdoms-- is presented in David G. Anderson’s (1994) The Savannah River Chiefdoms. Chase-Dunn, Anderson and Turchin (2005) present an overview of earlier theories and a new theoretical synthesis of the dynamics of agrarian state growth and decline, a population pressure iteration model and explanations of the rise and fall of modern hegemons. We surmise that the causes of upsweeps may differ from the causes of normal upcycles. We hypothesize that upsweeps of polity size are mainly caused by the phenomenon of semiperipheral marcher states in which a recently founded polity out on the edge of a region of older core states conquers the other states and makes a core-wide empire. In order to test this hypothesis we need to identify instances of empire upsweeps so that these can be compared with the many more frequent cases of upcycles. The study of scale changes in regional systems will also allow us to identify cases of collapse and to test Jared Diamond’s (2005) hypothesized causes of collapse.
Our approach is to explicate the main causes of state formation and upward sweeps of settlement sizes and polity sizes taking into account the ways in which the basic processes have been altered by the emergence of new institutions. Our theoretical approach will elaborate upon the recent work of Robert Bates Graber (2004). Graber develops two models that use population growth and population pressure to explain international political integration and global state formation. His so-called “ahistorical” model includes population growth rates and the number of independent polities. Graber’s so-called “historical” model takes account of the emergence of the League of Nations and the United Nations. We are developing an expanded version of Graber’s “historical” model that adds the rise and fall of hegemons, the emergence of markets and capitalism, and the growth of other international political organizations and non-governmental organizations to explain evolution of global governance, international political integration and future global state formation.
Measurement Issues:
Population Sizes of Largest Settlements and Territorial Sizes of Largest Polities
Our research uses two features of human social organization that can be quantitatively estimated to identify upsweeps and collapses.[4] Determining scale shifts requires real metric (interval-level) estimates, not just periodizations of growth and decline. The two quantitative features that we use are the population sizes of settlements and the territorial sizes of polities. These can be estimated over very long periods of time in several regions of the world. Recall that we define settlements for comparative purposes as the contiguous residential built-up area. This allows us to compare hamlets with megacities without needing to know anything about the political bounding of settlement governments (e.g. the city of Los Angeles, Los Angeles county, etc.) The contiguous built-up area is what is generally meant by urban agglomerations. But this definition is also useful for looking at both centralized and dispersed settlements in the past.[5] The populations’ sizes of settlements (cities) can be estimated even in the absence of any written documents based on the dating of the built-up area of the settlement. Of course, such estimates contain a good deal of error because population densities within settlements can vary greatly (Pasciuti and Chase-Dunn 2003; Pasciuti 2003). But these estimates are generally good enough to see the scale changes that are the focus of this study. Most of the city population size estimates used in this paper are taken from Modelski (2003) and Yoffee (2006).
Unlike settlements, the territorial sizes of polities cannot be accurately estimated from archaeological evidence alone. What we want to know is the territorial size of the area over which a central power exercises a degree of control that allows for the appropriation of important resources. Control falls off with distance from the center in all states and empires, and controlling larger and larger territories requires the invention of new transportation, communications technologies and techniques of power (Mann 1986). Military technologies and bureaucracies are key, but so are new ideologies and new technologies for communication (Innis 1950).
Estimating the territorial sizes of states and empires is done from historical atlases and for the ancient and classical worlds these are based primarily on knowledge about who conquered which city when, and whether or not tribute continued to be paid. Sometimes it is difficult to tell whether or not tribute is asymmetrical or symmetrical exchange. It is asymmetrical exchange that signifies a tributary imperial relationship.
Most of the large ancient and classical empires involved conquest of territory that that was contiguous with the home territory. But once naval power was taken up by tributary states an empire could encompass a client state that was far from its contiguously controlled territory, such as Rome’s control of areas on the south shore of the Mediterranean. If these distant non-contiguous tribute-payers were polities, not including them in the estimate of the territorial size of empire would not constitute a large error. But as capitalism moved from the semiperiphery to the core[6] capitalist nation-states adopted the thallasocratic form of empire that had been pioneered by semiperipheral capitalist city-states -- control over distant overseas colonies. The recent colonial empires (British, French, etc.) require estimating the territorial sizes of colonies that are spread across the seas. The increasing institutionalization of state territorial boundaries makes this much easier than it was in the ancient and classical worlds in which polity boundaries were fuzzy.
Not all maps in political atlases show the boundaries of territorial control. They may represent linguistic groups or other cultural distinctions that have little to do with state power. And maps may not have good time resolution. Our data on the territorial sizes of polities are mostly taken from the published articles of Rein Taagepera (1978a, 1978b, 1979, 1997), except that some estimates for South Asia have been added based on Schwartzberg (1992). [7]
Ideally we would like to have a minimum temporal resolution of about every twenty-five years because we are trying to study middle-run growth/decline phases of polities and settlements. Archaeological evidence of the areal sizes of settlements can be used to estimate settlement sizes, but the limitation here is temporal resolution. Studies that rely on radio-carbon dating are not able to achieve a level of temporal resolution that can make the settlement growth/decline phases that we wish to study visible. They typically have an error margin of around 200 years. In some regions, such as the Southwest of the United States, much finer (yearly) temporal resolution of settlement sizes is possible based on the dating of settlement construction with dendrochronology (tree rings). Thus our examination of upward sweeps of settlement size can, in principle, be extended to regions in which there are no written records.[8] When temporal resolution is less than 100 years we could be missing some of the cycles of growth and decline.
Regional Units of Analysis
We want to know the territorial size of the largest polity in a region and the population size of the largest city. This requires that we bound regions in some systematic way. We do this in two ways in this research. We use four constant regions: Mesopotamia, Egypt, East Asia and South Asia. But we also use the criterion of political-military interaction – the so-called PMN. This is a network of polities that are making war and allying with one another. This is the criterion we use to bound what we call the Central PMN,[9] which was born when the Mesopotamian and Egyptian state systems merged around 1500 BCE. That system continued to expand until it encompassed the whole globe in the 19th century CE. Each region was originally a separate PMN, and all these local systems were eventually incorporated into the Central PMN (Chase-Dunn and Jorgenson 2003). The question we ask is: how big is the largest city and the largest state in each region? So we are not really studying individual cities and states, but are rather studying the largest of these entities in each region, which is a temporally variable characteristic of the region.
Counting Cycles and Upsweeps
What follows is a set of thirteen figures that show our plots of settlement and polity upsweeps in four constant regions and in the Central PMN. We not only want to identify cases in which upsweeps and sustained collapses occur, but we want to count how many of these occur over time so that we can compare frequencies across regions. And in subsequent research we will determine which of the polity upcycles and upsweeps were instances of semiperipheral marcher conquest (Love et al 2010).
Our counts employ the following rules:
A cycle is an up and down sequence (or an up and flat sequence. One may wish to distinguish two kinds of upsweeps in terms of how they relate to earlier cycles and upsweeps. A “short-term upsweep” is more than 1/3 higher than the previous peak (or flat), whereas a “long-term upsweep” is more than 1/3 higher than any previous peak in the same region. It should also be noted that because we are looking at the largest entity in each region an upsweep may be carried out by a combination of cities or empires. If a certain polity starts to increase its size but then is passed by another polity both of these may be thought of as having contributed to a “compound upsweep.”
In our first region, Mesopotamia, archaeologists have uncovered data at sites dating to at least 4500 BCE. The earliest cities and polities at this time were quite small in comparison to the rapid increase in sizes that would occur a few millennia later. The first upsweep of record occurred adjacent to the Mesopotamian flood-plain in the Zagros mountains in what is now Southwestern Iran. This first-generation primary state called Susa/Shush (3500 BCE) was more than two and a half times the size of an earlier nearby paramount chiefdom called Urua (4500 BCE). Settlement and polity sizes then began growing in Central and Southern Mesopotamia, By approximately 2900 BCE Ur, a second-generation early state, appears, followed by the city-state of Kish in 2800 (Wright 2006: 14-15). The next upsweep in the region occurred beginning around 2500 BCE when an older core city-state achieved control over adjacent core city-states to form the Lagash Empire. Soon thereafter the much larger Akkadian Empire was formed when Sargon, having taking control of Kish, then conquered Lagash and a huge adjacent territory (cf. Yoffee 2006:142). Chase-Dunn and Hall (1997:85-89) first concluded that the Akkadian Empire as an instance of a semiperipheral marcher conquest (a recently formed state out on the edge of an old core region that rolls up the system) but later accepted the argument of Yoffee (1991) that the Akkadian expansion was spurred by the revolt of an ethnic underclass of Semitic-speakers (Chase-Dunn et al. 2006). More recent scholarship suggests that the Akkadian Empire may have been both an internal ethnic revolution in Kish followed by a semiperipheral conquest of the core Lagash system (see Love et al. 2010).
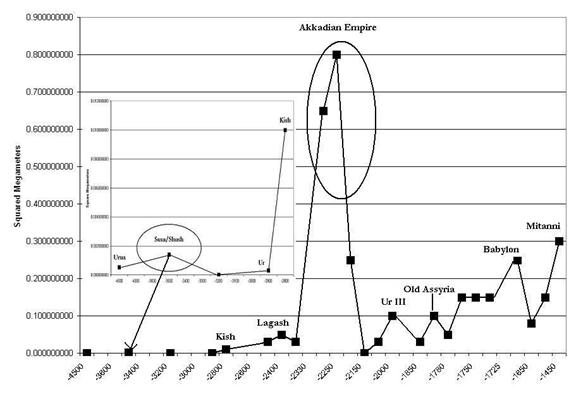
Figure 3: Largest polities in the Mesopotamian Region, 4500 BCE-1500 BCE
In Figure 3 there are three upsweeps between the earliest point at which we have estimates of the territorial sizes of polities, 4500 BCE and 1450 BCE (when the Mesopotamian PMN merged with the Egyptian PMN.) The units on the vertical axis are square megameters[10] of territorial size. The three upsweeps are: Susa/Shush (0.0014 MM2 @ 3500 BCE; Lagash (.05 @ -2400) and the much larger Akkadian Empire (0.80 @ -2250). Recall our definition of upsweeps: a point that is more than 1/3 larger than the highest earlier peak. The Susa/Shush and Lagash upsweeps clearly qualify. The Akkadian empire was huge, but brief. Perhaps it should be called a surge rather than an upward sweep, because it was a long while before empires of comparable size were to emerge.[11] The equilibrium size of polities revealed by subsequent peaks after the Akkadian Empire was larger than the preceding peak of Lagash. The Akkadian empire should therefore be designated as a combination of a surge and an upward sweep. Following the collapse of the Akkadian Empire, there was a steady increase in the size of empires, from the Third Dynasty of Ur peaking in 2000 BCE at .10, through the Assyrian Empire, Babylonia, which peaked at .25 in -1690, to Mitanni at .30 in -1450; however, none of these empires approached the size of the Akkadian empire. What happened after the Akkadian Empire should not be considered a collapse because the upsweep of the Akkadian Empire had not established a new high equilibrium. A collapse is more than a downward sweep. It is a downward sweep in the context of a system that has established a high equilibrium. Thus we count three upsweeps and seven cycles in Mesopotamia during this period.
Counting cycles is important, because we want to know how regions are similar or different with regard to the average number of cycles per year, and the number of cycles per upsweep. In the counts of cycles we include upsweeps, and if an upcycle levels out to a subsequent data point, we count it as a separate cycle. So an upcycle followed by a data point that is equally as high as the peak (a flat line) which is then is followed by another upcycle counts as two cycles. We will indicate an example of this when it occurs in the Figures below.
Mesopotamia was also the location for the earliest largest known cities in the world. From the legend of Sargon, the king whose conquests created the giant Akkadian Empire, it is revealed that a new capital city named Agade (Akkad) was built somewhere near Kish. But the exact location of Agade has not been positively identified among the tell mounds of Iraq and so we cannot estimate its size. This important missing case means we should be careful about drawing firm conclusions regarding the exact shape of city growth in Mesopotamia. What we do know is the Mesopotamian region was the heartland of cities – the first place on Earth where large numbers of people figured out how to live in close proximity with one another.
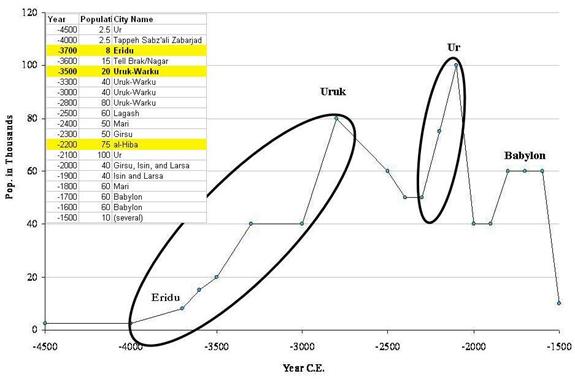
Figure 4: Largest cities in Mesopotamia, 4500 BCE-1500 BCE
Figure 4 shows the largest known cities in Mesopotamia from 4500 to 1500 BCE when the Mesopotamian and Egyptian PMNs merged to become the Central PMN. The units on the vertical axis are thousands of city residents. The first upsweep was begun by Eridu with 8,000 people in 3700 BCE, followed by Tell Brak/Nagar at 15k a century later, but these two cities were dwarfed by Uruk/Warka, which peaked at 80,000 inhabitants in 2800 BCE. The second upsweep was begun by al-Hiba with 75,000 residents at -2200, but the largest city in the region—and in the world—was Ur, with 100,000 people at 2100 BCE.[12] So there were two urban upsweeps and four cycles during this period in the Mesopotamian region. As mentioned before, the first upsweep is counted as two cycles because there is a flat period in between the first and second rises.
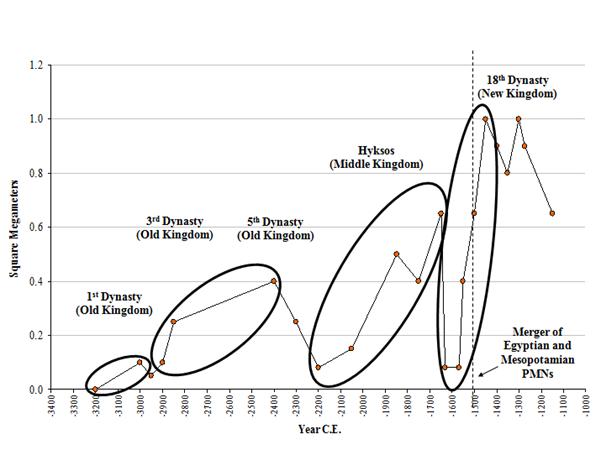
Figure 5: Largest states and empires in Egypt, 3200 BCE-1000 BCE
Figure 5 shows the largest states and empires in Egypt from 3200 BCE to 1000 BCE, but we stop counting cycles and upsweeps at 1500 BCE when the Mesopotamian and Egyptian PMNs merged to become the Central PMN (See Figures 7-10 below). Figure 5 also shows the years between 1500 BCE and 1150 BCE so that we can see what happened with the upsweep that had begun just before 1500 BCE. There were four polity upsweeps and 4 ½ cycles between 3200 BCE and 1500 BCE.[13]
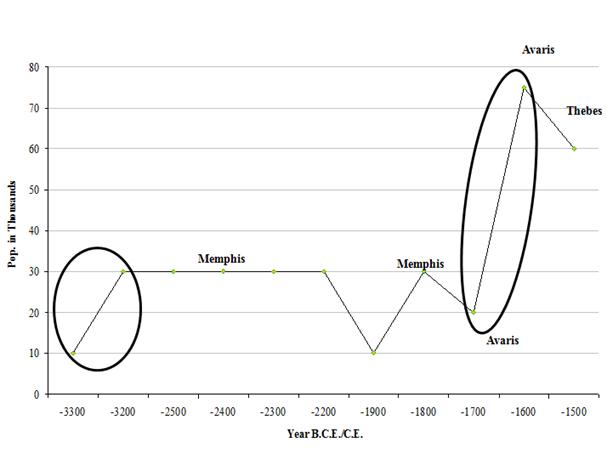
Figure 6: Egyptian Largest Cities 3300 BCE-1500 BCE
Figure 6 shows the sizes of the largest cities in Egypt from 3300 BCE to 1500 BCE. Here we see the rise of Memphis, its decline and recovery, and then the rise of Avaris, the Hyksos capital. So the count is two urban upsweeps and three cycles.
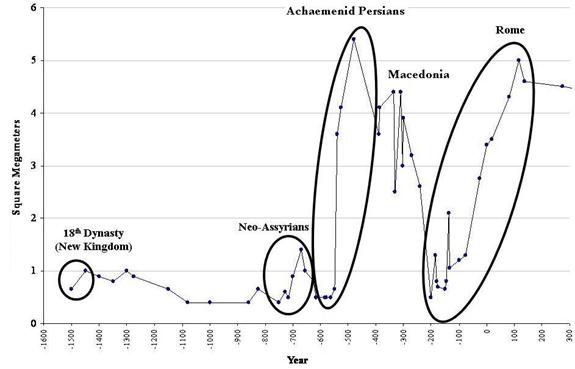
Figure 7: Largest Empires in the Early Central System, 1500 BCE- 300 CE
We divide the Central System, the expanding political-military network of states, into early and late periods so that the large scale-changes of recent centuries do not obscure the earlier cycles and upsweeps. Figure 7 shows the twelve polity cycles and four upsweeps from 1500 BCE to 300 CE. Again, the units on the vertical axis are square megameters of territorial size. Rome could be called a recovery rather than a polity upsweep because the earlier Persian Empire was as large. But we will still designate Rome as an upsweep because, though it was part of the same political/military network, it is in a substantially different location than the earlier Persian and Alexandrian empires were. The rise of Rome constituted a shift of the core of old Western Asian/Eastern Mediterranean system toward the West, with a new “great power” emerging on the Italian peninsula. There are 12 cycles visible in this network over this time period. All of the upsweeps, except the first in Egypt, were probably the result of semiperipheral marcher conquests. The Neo-Assyrians, now dominated by an Amorite ruling class, radically changed the commercial strategy of the Old Assyrian City-State into a very successful conquest strategy. The Achaemenid Persians are said to have been originally pastoralist nomads from Iran who conquered the entire core region of Western Asia and some of the Eastern Mediterranean [from Bactria (Afghanistan) to Egypt]. Alexander was from semiperipheral Macedonia, and the Romans were Latin farmers living in the shadow of Etruscan cities.[14]
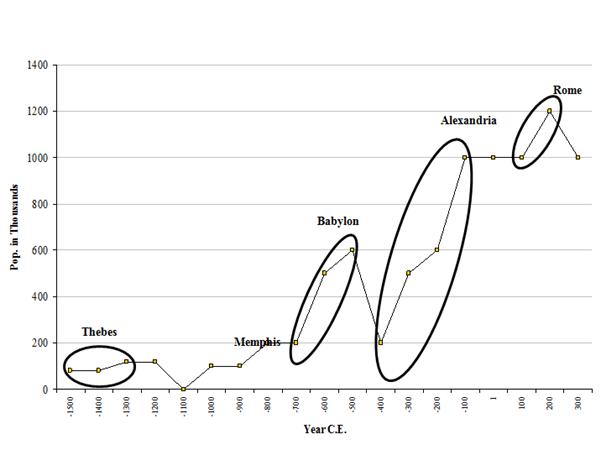
Figure 8: Early Central System Largest Cities, 1500 BCE- 300 CE
Figure 8 shows the sizes of the largest cities in the early Central PMN from 1500 BCE (the period following the consolidation of the Egyptian and Mesopotamian PMNs into one PMN) to 300 CE. There were four city size upsweeps and six cycles. Remember that we count upcycles that are separated by a flat period as separate cycles.
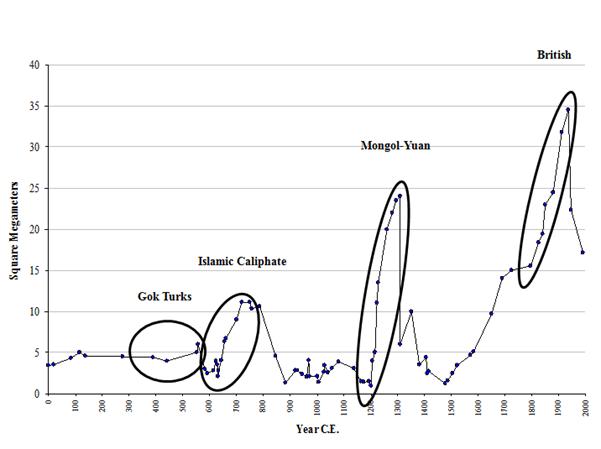
Figure 9: Largest Empires in the Late Central PMN
Figure 9 shows the largest polities in the late Central PMN from the birth of Christ until 2000 CE when Taagepera’s estimates end. We already counted the Roman upsweep in Figure 8. So there are four new upsweeps and fourteen new cycles that have not already been counted. We may be seeing more cycles because the temporal resolution is now much better. We have included both the Gok Turk and the Mongol Empires in Figure 9 even though they emerged in Central Asia, more on the edge of the East Asian PMN than on the edge of the Central PMN. Interestingly, the Gok Turk Empire was an upsweep in the Central System because it was more than 1/3 larger the Rome, but it was not an upsweep in East Asia because it was not larger than the earlier Hsiung-Nu Empire (see Figure 12 below). Central Asia played an important role in the developing connections between East and West both because of the Silk Roads trade routes and because Central Asian steppe nomads repeatedly formed huge military confederacies that attacked and sometimes conquered the agrarian civilizations of both the East and the West.
All the upsweeps in Figure 9 were the accomplishments of either semiperipheral or peripheral marcher states, or in the case of the British Empire, a modern semiperipheral capitalist nation-state rising to hegemony.[15] A peripheral marcher state is usually one in which a confederation of nomads from an adjacent region invades an agrarian region and quickly puts together a territorial empire that encompasses most or all of the old core region. A semiperipheral marcher state is one in which peripheral people settle on the edge of an old core region, go through state formation and class formation, and then conquer the older core states.
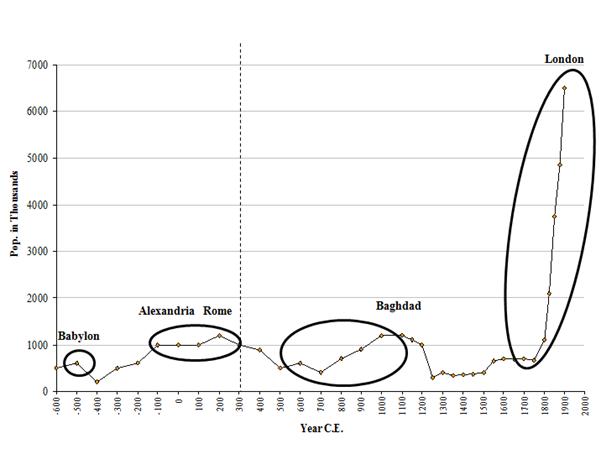
Figure 10: Largest Cities in the Late Central PMN
Figure 10 shows the sizes of the largest cities in the Central PMN from 600 BCE to 2000 CE. We already counted the Babylonian and Roman upsweeps in Figure 8. Perhaps Baghdad should not be termed an upward sweep. In 1000 CE it had a population of around 1,200,000 people, about the same number that Rome had had in 200 CE, 800 years earlier. We called Rome an upward sweep because it was in a region within the Central PMN that had never had such a large city before. Islamic Baghdad grew up in the old heartland of cities on the Mesopotamian flood plain, but it was far larger than any city in that area had ever been before. For this reason we are willing to include the rise of Baghdad in our count of city upsweeps. Thus Figure 10 contains two new urban upsweeps and 4 ½ cycles that have not been previously counted.
The meteoric last city size upsweep was begun by Constantinople, then London and then New York. We do not include the 20th century rise of New York in Figure 9 because the scale of New York makes it very hard to see what was happening at the earlier end of this sequence. Logging the city populations is one solution, but that makes it difficult to see which rises were really upsweeps.
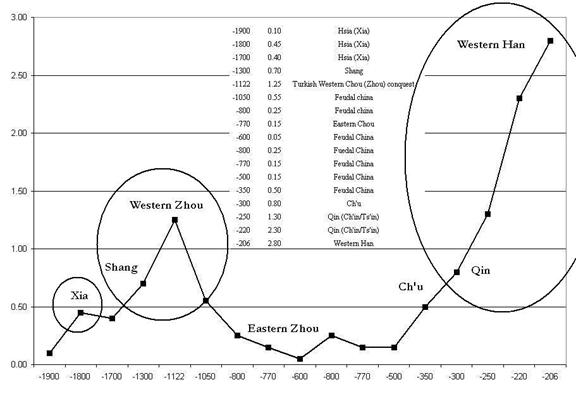
Figure 11: Largest Polities in the Early East Asian Region, 1900 BCE-206 BCE
Figure 11 shows the territorial sizes in square megameters of the largest polities (states and empires) in East Asia from 1900 BCE to 206 BCE. There are three upsweeps in this period and 3 1/2 cycles. The first upsweep is that of the Xia Dynasty, which is followed by composite upsweep carried out by both the Shang Dynasty and the Western Zhou (Huang et al 2003). The size of Shang peaked during the early Upper Erligang archaeological phase (estimated as 1510-1450BCE) having Zhenghow as the largest central site (Liu 2003: 98). The third is another compound upsweep carried out by four different polities – the Chu, Qin, Western Han and Hsiung-nu (not shown, see Figure 12).
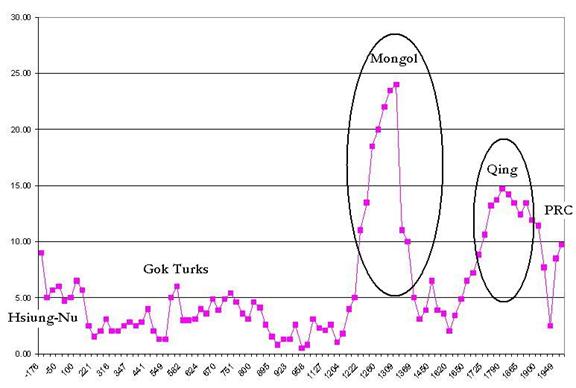
Figure 12: Territorial sizes of largest states and empires in Later East Asia
Figure 12 shows the sizes of the largest states and empires in East Asia from 176 BCE to 1950 CE. We see that the upsweep that started in Figure 11 was taken to a very high peak by the Hsiung-Nu, a steppe nomad conqueror state that some scholars believe was composed of the same people who were known as the Huns in the West. Using the same logic as before, we will not label as an upsweep the impressive rise of the Gok Turks, a rather different group from Central Asia, because it occurred in nearly the same territory as that put together by the Hsiung-nu and was not as large. So we call that a recovery. Obviously the Mongol Empire is an upsweep. We will also consider the Qing Dynasty an upsweep because it was larger than any earlier Chinese dynasty. The number of upsweeps in East Asia in this period was two and there were 20 cycles (adding those from Figure 11 we have at total of five polity upsweeps and 24 ½ cycles for East Asia between 1900 BCE and 1950 CE ).
All these upsweeps involved semiperipheral or peripheral marcher states. The Hsiung-Nu were classic horse pastoralist nomads who came out of Central Asia, very similar to the later Mongols. The Turks were also from Central Asia but they were different. They were originally hill people who specialized in mining and metallurgy. They became an important ethnicity in a Central Asian state, took over that state and then led several expansive conquests toward both the east and the west (Chase-Dunn et al 2006). And of course the Manchus who built the Qing Dynasty were northern forest people.
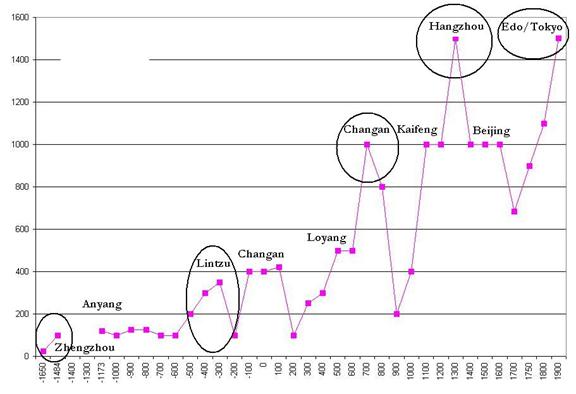
Figure 13: Largest cities in East Asia
Figure 13 shows the largest East Asian cities from 1650 BCE to 1900 CE. The first upsweep is associated with the rise of the Shang dynasty. The Lintzu-Changan transition was not an upsweep because 2nd century Changan did not get much larger than Lintzu had been. The rise of Edo (Tokyo) as the largest city of the East Asian region was the culmination of a long period during which Japan was able to rapidly develop a fully-formed city network by learning from the much slower emergence of a filled-out urban system in China (Rozman 1973). We count Edo as an upsweep because it was in a new area, though it was not larger than Hangzhou had been 600 years earlier. Thus we find five urban upsweeps and 8 1/2 cycles.
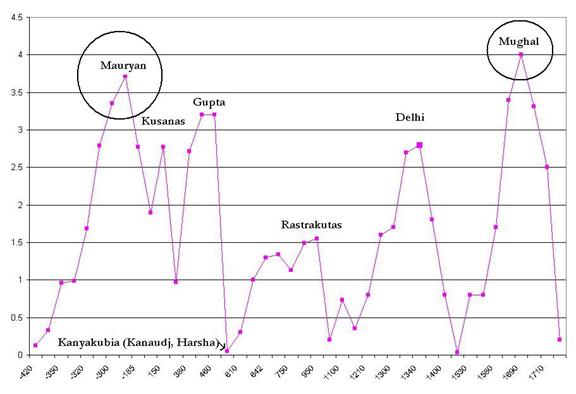
Figure 14: Largest states and empires in South Asia
Figure 14 shows the largest states and empires in South Asia from 420 BCE to 1770 CE, but not including the modern European colonies in South Asia (e.g. the British Empire). Of course the Indus River valley had contained a large Bronze Age civilization with large cities and polities. Obviously this was an earlier South Asian upward sweep, but we do not have quantifiable estimates of the Harappan polity sizes in the Indus Valley.
We extended Taagepera’s estimates back from 620 CE to 420 BCE by estimating the territorial sizes of states using maps in Schwartzberg (1992).[16] Figure 14 shows only two upsweeps. The Mauryan Empire at its peak in 260 BCE was nearly as large as the Mughal Empire at its peak in 1690 CE 950 years later. The geography of the South Asia provided a ceiling, but this does not explain the long interregnum between the two very large empires and the long periods in which the subcontinent hosted a system of rather small states. The Delhi Empire in the middle is deemed a recovery because it was centered in the Ganges River Valley, which had also been the center of the prior Mauryan Empire, but it was not nearly as large as the Mauryan. There are eleven cycles visible in Figure 14. The South Asian sequence is rather unlike other regions because of the long period of political decentralization following the Mauryan. This long trough in the sequence of rise and fall is the main reason why South Asia is out of synchrony with the periodicity of both Eastern and Western empire cycles (Chase-Dunn, Manning and Hall 2000).
The Mauryan Empire was not itself a semiperipheral marcher state, but it was made possible by the invasion of South Asia by Alexander’s armies. The Mauryans basically reconquered South Asia and then held it when the Greek Seleucids tried to get it back. Delhi was another Ganges River valley state that eventually managed to put a large polity back together after a long period of political decentralization. The Mauryan Empire was a nativist reconquest in response to a semiperipheral marcher invasion from a neighboring PMN. Once the Greek-led armies were expelled, the South Asian and Central PMNs remained disconnected in terms of warfare and alliances until the arrival of Turkic armies in the 13th century CE.
The Moguls were Central Asian Moslems who were descended from Genghis Khan and Tamerlane and who brought Persian culture to South Asia when they conquered it. This was a semiperipheral marcher conquest.
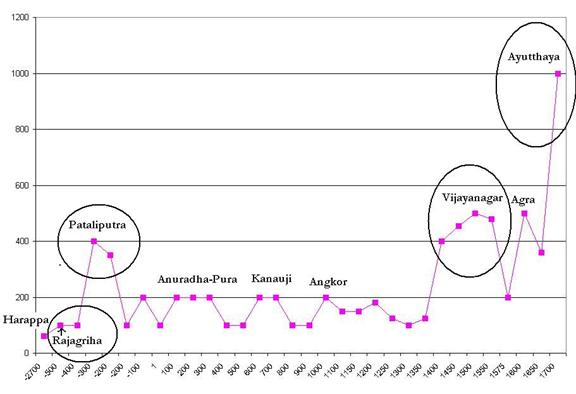
Figure 15: South Asian Largest Cities, 2700 BCE-1700 CE
Figure 15 shows the sizes of the largest cities in South Asia from 2700 BCE to 1700 CE. The first urban upsweep occurred some time in the period between the decline of Bronze Age Harappa and Mohenjendaro (Indus Civilization cities) and the rise of Rajagriha. There were probably a lot of cycles during this 2200 year period of missing data and perhaps some upsweeps as well. Pataliputra was the capital of the Mauryan Empire. Then a long period of smaller cities follows that corresponds with the political decentralization seen in Figure 14. Vijayanagar was the capital of a South Indian empire and Ayutthaya was the capital of the Ayutthaya Kingdom in Thailand. In Figure 15 we see four urban upsweeps and 9 ½ cycles.
|
Region or PMN |
Time period |
# of upsweeps |
Avg. Years per upsweep |
# of cycles |
Avg. Years per cycle |
# of upsweeps per cycle |
|
Mesopotamia |
-4500/-1500 |
2 |
1500 |
4 |
750 |
.50 |
|
Egypt |
-3300/-1500 |
2 |
900 |
3 |
600 |
.66 |
|
Central PMN |
-1500/2000 |
6 |
583 |
10.5 |
333 |
.57 |
|
East Asia |
-1600/1900 |
5 |
700 |
8.5 |
412 |
.59 |
|
South Asia |
-2700/1700 |
4 |
1100 |
9.5 |
463 |
.42 |
|
Table average |
|
|
956 |
|
512 |
.55 |
|
Totals |
|
19 |
|
35.5 |
|
|
Table 1: City size upsweeps (population sizes of largest cities)
Table 1 shows the summary statistics for urban upward sweeps and the number of cycles for each of the regions that we studied in the figures above. We counted a total of 19 urban upsweeps and 35.5 urban cycles. The average number of years per upsweep across regions varied from 583 for the Central PMN to 1500 for the Mesopotamian region and the average for the five regions was 956 years per urban upsweep. This may be an overestimate because of the poorer temporal resolution of settlement sizes in the earlier periods(Egypt, Mesopotamia and the long period between Indus Harappa and the Ganges River cities that is missing from the South Asian data). The rate of upsweeps varied across regions, but less so than in the empire upsweeps shown in Table 2 below.
The average years per cycle across all the regions was 512, and this varied from 333 for the Central PMN to a high of 750 for Mesopotamia. This is good news for the issue of the necessary temporal resolution of quantitative estimates because even with estimates at 100-year intervals most of the cycles would be visible.
We also calculated the number of upsweeps per cycle for each of the five regions. The average across the regions was .55 with a low of .42 in South Asia and a high of .66 for Egypt. There is less variation across regions for this ratio than for our other estimates. Both cycles and upsweeps are long and about half of all cycles are upsweeps.
|
Region or PMN |
Time period |
# of upsweeps |
Avg. Years per upsweep |
# of cycles |
Avg. Years per cycle |
# of upsweeps per cycle |
|
Mesopotamia |
-4500/-1450 |
3 |
1017 |
7.5 |
407 |
.40 |
|
Egypt |
-3200/-1500 |
4 |
425 |
4.5 |
377 |
.88 |
|
Central PMN |
-1500/2000 |
8 |
437 |
26 |
135 |
.27 |
|
East Asia |
-1900/1950 |
5 |
770 |
24.5 |
157 |
.20 |
|
South Asia |
-420/1770 |
2 |
1095 |
11 |
199 |
.18 |
|
Table average |
|
|
748 |
|
255 |
.39 |
|
Totals |
|
22 |
|
73.5 |
|
|
Table 2: Polity size upsweeps (territorial sizes of largest empires)
Table 2 shows the summary statistics for the empire upsweeps and the number of rise and fall cycles for each region. We counted a total of 22 polity upsweeps and 73.5 polity cycles. The total number of urban and polity upsweeps were about the same (19/22) but there wer more than twices as many polity cycles as there were urban cycles (73.5/35.5). The average years per polity upsweep across all the five regions was 748. The variation is from 425 for Egypt to a high of 1095 for South Asia. The average number of cycles per year across these five regions was 255, with a low of 135 for the Central PMN and a high of 407 for Mesopotamia. The relatively high years per cycle for Egypt and Mesopotamia is similar to that found for the cities in Table 1, but, unlike for cities, it is unlikely to be an artifact of poor temporal resolution because Taagepera’s method of reporting changes in empire sizes produces better temporal resolution than we have for the early settlement size estimates.
The average number of years per upsweep is longer for cities (956) than it is for empires (733). The average number of years per cycle is almost twice as long for the cities (512) as for the empires (224). Empire cycles are much shorter than city cycles, and empire upsweeps are occur somewhat more frequently (733) than city upsweeps (956). All this implies that it takes longer to figure out how to build a larger city than it does to figure out how to build a larger empire.
The most important of the regional “cases” we have studied are the Central PMN and East Asia because these are large and we have estimates over very long periods of time. Comparing the empire histories of these two regions we see that upsweeps are more frequent in the Central System (500) than in East Asia (770). The number of polity cycles per year in the two regions are similar (135/157). With regard to the ratio of upsweeps per cycle, the Central system has .27 and East Asia has .20, so more cycles are upsweeps in the West than in the East.
Regarding urban trajectories we find the same difference in upsweeps. The Central System has more frequent urban upsweeps (583) versus 700 years per upsweep in East Asia. The urban cycles are also somewhat shorter in the Central System (333) than in East Asia (412). But the two regions are quite similar with regard to the number of urban upsweeps per cycle (.57 and .59).
When sets of interacting polities are studied there are few long-term collapses. Most usually when one city or polity declines another one of similar size rises. The one exception seems to be what happened in South Asia after the decline of the Mauryan Empire.
Earlier investigations have examined the relations between urban and empire cycles (Chase-Dunn, Álvarez, and Pasciuti 2005) but this has not been done with a specific focus on upward sweeps. Do city upward sweeps tend to follow rather than precede empire upward sweeps, as we would expect based on the notion that it is large empires that construct large capital cities? Our efforts to find explanations for city and empire upsweeps or things like the long trough of decentralization in South Asia in the writings of historians has not born much fruit. Most historians are unaware of the quantitative changes we are discussing or do not see them in a comparative context. The identification of upward sweeps with quantitative data provides a list of historical events that can be the focus of efforts to test theories of social evolution that can account for the long-term growth trends by means of proximal causes. [17]
References
Anderson, David G. 1994 The Savannah River Chiefdoms. Tuscaloosa: University of Alabama Press.
Chase-Dunn, Christopher and Thomas D. Hall 1997 Rise and Demise: Comparing World-Systems. Boulder, CO: Westview
Chase-Dunn, C., Susan Manning and Thomas D. Hall, 2000 "Rise and Fall: East-West Synchronicity and Indic Exceptionalism Reexamined" Social Science History 24,4: 721-48(Winter) .
Chase-Dunn, Christopher, Alexis Álvarez, and Daniel Pasciuti 2005 "Power and Size; urbanization and empire formation in world-systems" Pp. 92-112 in C. Chase-Dunn and E.N. Anderson (eds.) The Historical Evolution of World-Systems. New York: Palgrave.
Chase-Dunn, C., E.N. Anderson and Peter Turchin 2005 “Global state formation: modeling the rise, fall and upward sweeps of large polities in world history and the global future” https://irows.ucr.edu/research/citemp/globstat/globstatprop.htm
Chase-Dunn, C. and Andrew K. Jorgenson 2003 “Regions and Interaction Networks: an institutional materialist perspective,” International Journal of Comparative Sociology 44,1:433-450.
Diamond, Jared 2005 Collapse. New York: Viking
Fagan, Brian 2004 The Long Summer: how climate changed civilization. New York: Basic Books.
Fletcher, Roland 1995 The Limits of Settlement Growth. Cambridge: Cambridge University Press.
Graber, Robert Bates 2004 “Is a world state just a matter of time?: a population-pressure
alternative.” Cross-Cultural Research 38,2:147-161 (May).
Hall, Thomas D., Christopher Chase-Dunn and Richard Niemeyer 2009 “The roles of Central Asian middlemen and marcher states in Afroeurasian world-system synchrony” in Ganesh Trichur (ed.) Asian Regionality in the Twenty-First Century: New Perspectives on the Modern World-System. Westport, CT.: Greenwood Press.
Hart, Hornell 1948 “The logistic growth of political areas” Social Forces 26,4: 396-408.
Huang, Chun Chang, Shichhao Zhao, Jiangli Pang, Qunying Zhou, Shue Chen, Ping Li, Longjiang Mao and Min Ding 2003 “Climatic aridity and the relocations of the Zhou culture in the Southern Loess Plateau of China” Climatic Change 61:361-378.
Innis, Harold 1972 [1950] Empire and Communications. Toronto: University of Toronto Press.
Liu, Li and Xingcan Chen 2003 State Formation in Early China. London: Duckworth
Love, James, Alexis Alvarez, Hiroko Inoue, Kirk Lawrence, Evelyn Courtney, Edwin Elias, Tony Roberts, Joseph Genova, Victoria Autelli, Sean Liyanage, Joshua Hopps and Chris Chase-Dunn 2010 “Semiperipheral Development and Empire Upsweeps Since the Bronze Age” IROWS Working Paper #56.
Mann, Michael 1986 The Sources of Social Power, Vol. 1. Cambridge: Cambridge University
Press
Modelski, George 2003 World Cities: –3000 to 2000. Washington, DC: Faros 2000
Pasciuti, Daniel and Christopher Chase-Dunn 2003 “Estimating the population sizes of cities” https://irows.ucr.edu/research/citemp/estcit/estcit.htm
Pasciuti, Daniel 2003 “A measurement error model for estimating the populations of cities,” https://irows.ucr.edu/research/citemp/estcit/modpop/modcitpop.htm
Rozman, Gilbert 1973 Urban Networks in Ching China and Tokogawa Japan. Princeton, NJ: Princeton University Press.
Schwartzberg, Joseph E. 1992 A Historical atlas of South Asia New York: Oxford University Press. http://dsal.uchicago.edu/reference/schwartzberg/
Taagepera, Rein 1978a "Size and duration of empires: systematics of size" Social Science Research 7:108-27.
______ 1978b "Size and duration of empires: growth-decline curves, 3000 to 600 B.C." Social Science Research, 7 :180-96.
______1979 "Size and duration of empires: growth-decline curves, 600 B.C. to 600 A.D." Social Science History 3,3-4:115-38.
_______1997 “Expansion and contraction patterns of large polities: context for Russia.” International Studies Quarterly 41,3:475-504.
Tainter, Joseph 1988 The Collapse of Complex Societies. Cambridge: Cambridge University Press.
Turchin, Peter 2009 “A theory for formation of large empires” Journal of Global History 4: 191-217.
Turchin, Peter and Sergey Nefadov 2009 Secular Cycles Princeton, NJ: Princeton University Press.
White, D. R., Natasa Kejzar and Laurent Tambayong 2006 “Oscillatory dynamics of city-size distributions in world historical systems”. Pp. 190-225 in G. Modelski, T. Devezas and W. Thompson, (eds.) Globalization as Evolutionary Process: Modeling, Simulating, and Forecasting Global Change.. London: Routledge.
Wilcox, David R., David A. Gregory and J. Brett Hill 2007 “Zuni in the Puebloan and Southestern Worlds” Pp 165-209 in David A. Gregory annd David R. Wilcox (eds.) Zuni Origins: Toward a New Synthesis of Southwestern Archaeology
Wilkinson, David. 1987 "Central civilization" Comparative Civilizations Review 17:31-59 (Fall).
Wright, Henry T. 2006 “Atlas of Chiefdoms and Early States” Structure and Dynamics 1,4.
http://escholarship.org/uc/item/2r63702g#page-1
Yoffee, Norman 1991 “The collapse of ancient
Mesopotamian states and civilization.”
Pp. 44-68 in Norman Yoffee and George Cowgill (eds.) The Collapse of Ancient
States
and Civilizations. Tucson: University of Arizona Press.
Yoffee, Norman. 2006. Myths of the Archaic State: Evolution of the Earliest Cities, States, and Civilizations. New York: Cambridge University Press.
Endnotes
[1] The project is the Polities and Settlements Research Working Group at the Institute of Research on World-Systems at the University of California-Riverside. The project web site is at https://irows.ucr.edu/research/citemp/citemp.html
[2] We use the term “polity” to generally denote a spatially-bounded realm of sovereign authority such as a band, tribe, chiefdom, state or empire. The term “settlement” includes camps, hamlets, villages, towns and cities. Settlements are spatially bounded for comparative purposes as the contiguous built-up area.
[3] We have been trying to develop quantitative
estimates of largest settlement sizes based on archaeological evidence for
regions in Mesoamerica and for the
[4] The excel data files used for graphing the settlement and polity cycles and upsweeps are available in the Appendix at irows.ucr.edu/cd/appendices/upsweeps/upsweepsapp.htm
[5] Dispersed settlements present more of a problem than those in which there is a concentrated area of residences. This problem is resolved by estimating the population residing in a standard circumference from the spatial center of the built-up area. In the U.S. Southwest, where settlements were often dispersed, we use 2 kilometer and 18 kilometer circumferences.
[6] The comparative world-systems perspective developed by Chase-Dunn and Hall (1997) traces the emergence of production for commodified exchange to the emergence of specialized trading states in semiperipheral regions – so-called “semiperipheral capitalist city-states.”
[7] The outline of a polity was traced on graph paper and the number of squares it occupied on the paper was estimated. Each square on the paper had an area of 0.25 cm². Knowing the number of squares the map of the polity occupies, and the area of each square, we can get an estimate of the area of each mapped polity in square centimeters. Each map in Schwartzberg's atlas also has it's own scale, usually either 1.2 cm per 100 miles, 0.6 cm per 100 miles, or 0.4 cm per 100 miles. Using the linear scale, the area of each map is then 1.44 cm²/100000 miles², 0.36 cm²/ 100000 mi², and 0.16 cm²/100000 mi². Knowing the estimated area of each mapped polity and it's scale, the estimate of its historical territory size can be found by dividing it's map size by it's scale. For example, Schwartzberg's atlas shows that the Mauryan empire in 324 BCE was about 55 squares on the graph paper on a scale of 0.36 cm²/10000 mi². Our estimate of the Mauryan empire at this time point is (55 squares)x (0.25 cm²)/ (0.36/10000 mi ²) or roughly 382,000 mi ². A conversion from square miles to square megameters was done using a conversion calculator. For the Mauryans at 324 BCE, we are left with a estimate of about .99 square megameters. For many empires, only one map of it's territory was shown and we assumed it was a map of the empire at it's territorial height. In this case, Schwartzberg's text in the back of his atlas helped with picking a time point for the territorial size.
[8] With tree rings it is also easy to study climate change effects on settlement growth/decline phases.
[9] The idea of the Central System is derived
from David Wilkinson’s (1987) definition of “Central Civilization.” It
spatially bounds a system in terms of a set of allying and fighting polities,
and the Central System (or Political-Military Network) is the one that emerged
in
[10] A square megameter is one million square meters.
[11] The Neo-Assyrian Empire was as large as the Akkadian but did not emerge until after the period shown in Figure 3.
[12] The rise and collapse of the Third Dynasty of Ur has been recently described by Fagan (2004:2-7) who argues for the importance of climate change as a cause of both its rise and the decline.
[13] Chase-Dunn, Pasciuti, Álvarez and Hall
(2006) compare the pattern of Bronze Age growth/decline phases of cities and
empires in Mesopotamia and
[14] The Etruscans were probably migrants from the old West Asian core region.
[15] All three of the modern hegemons (the Dutch in 17th
century, the British in the 19th century and the
[17] Our next step will be to produce a close study of the polity and settlement upsweeps to test the hypothesis of semiperipheral development. How many of the empire upsweeps were due to the rise of semiperipheral marcher states and how many were not?