Appendix to Power and Size:
Urban and Polity Size Swings and changes in the distribution of power
among states in interstate systems since the bronze age
v. 8-11-17
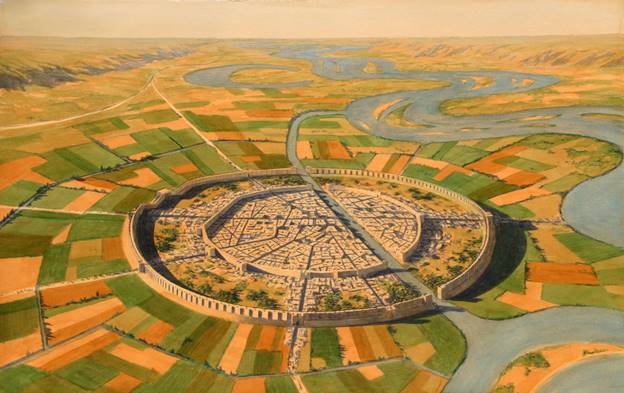
Mari (modern Tell Hariri, Syria) 2900 BCE -
1759 BCE (middle chronology)
Christopher Chase-Dunn, Hiroko
Inoue and Levin Welch
IROWS Working Paper # 108 available at https://irows.ucr.edu/papers/irows108/irows108.htm
Appendix url: https://irows.ucr.edu/cd/appendices/powsize/powsizeapp.htm
Table of Contents
Wilkinson’s Power Concentration Codings
https://irows.ucr.edu/cd/appendices/powsize/powconfig.xls
Our
Estimates of Largest City and Polity Sizes
https://irows.ucr.edu/cd/appendices/powsize/citypolity.xlsx
Comparison between
50 year and 100 year estimation time points for the Central PMN
https://irows.ucr.edu/cd/appendices/powsize/compare50and100.xlsx
Excel File
Combining Wilkinson’s Power Concentration with City and Polity Size Estimates
https://irows.ucr.edu/cd/appendices/powsize/powsize.xlsx
Short paper discussin the population size of
Hangzhou and its connection with changes in the geopolitical structure of East
Asia https://irows.ucr.edu/papers/irows111/irows111.htm
List of resources for studying the Aegean PMN 1600 bce – 600bce
Warfare
Data
Cioffi and Lai, Ancient China 2697 bce-729 bce
Data set:
Codebook:
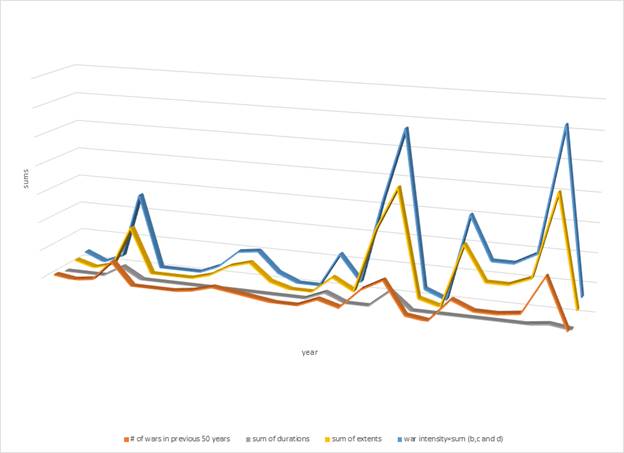
Figure A1: Component of Early East Asian warfare intensity scores (1900
bce- 700 bce (50 year intervals)
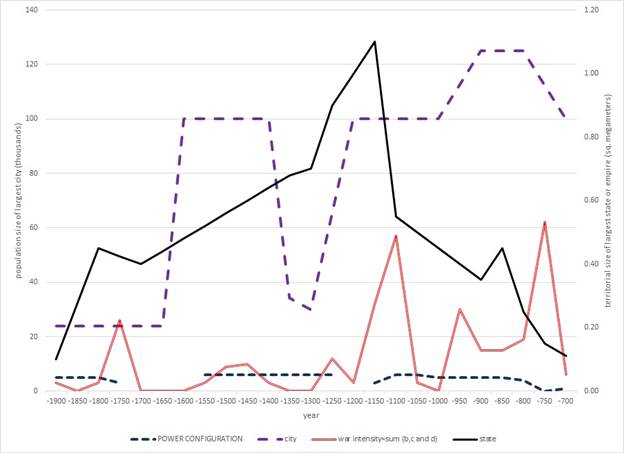
Figure A2: Warfare, Power Concentration, City Sizes and State Sizes in
Early China (1900 bce-700 bce) 50-year intervals
The
correlations based on the numbers in Figure A2are interesting. Warfare intensity
is correlated with year Pearson’s r= .45
(more wars in more recent years). This could be because the number and size of
wars increased over time or because our knowledge of the existence of wars improved.
The Xia epoch of Chinese history that constituted the early part of these
estimates (before 1797 bce) is not well-documented, and our knowledge of the Shang
epoch 1797 to 1120 bce is less well-known that the Western Zhou epic (1120 to
729 bce). Improvements in the completeness of documentation may explain the
correlation between conflict and year.
It is hard to see in Figure A2 5 because of
scaling, but there is a negative correlation between war intensity and power
concentration (-.49), and this may not be due to a secular trend because
usually power concentration is not correlated with year. Geopolitical theory
generally predicts that more power concentration will produce less war because
the preponderance of a great power dissuades challengers. The correlation
between city size and war intensity is .38. This is probably mostly due
to the fact that both increase with year (trend). We will calculate the
partial correlation controlling for year but have not done that yet.
The correlation between the
territorial size of the largest polity and war intensity is -.07. probably
zero. Better temporal resolution may find that warfare decreases the size
of the largest city, but we do not see it with the fifty-year intervals.
Brecke and Kang, East Asia 1400 cd- 1999 ce
Breck Conflict Catalogue 1500 ce- 1854 ce