Urban Upsweeps and
Collapses Inventory Appendix
![]()
irows.ucr.edu/cd/appendices/setsweeps/setsweepsapp.htmAppendix to “Settlement Scale Shifts Since the Bronze Age: Upsweeps and Collapses and Semiperipheral Development”
Hiroko Inoue,
Alexis Álvarez, Eugene N. Anderson,
Jared Ahmed
and Christopher Chase-Dunn
Institute for Research on World-Systems, University of California-Riverside
This
research was supported by National Science Foundation Grant #: NSF-HSD
SES-0527720.
v. 4-29-13
Appendix
Table of Contents
Excel data files of largest city sizes: Mesopotamia, Egypt, Central System, South Asia, East Asia
Excel data file with urban upsweeps and downsweeps counts
Excel
data file containing Ian Fletcher’s estimates of city and empire sizes
Table A1: List of Sweeps and
comparison of two methods of calculation
Table A2: Cycles and Sweep
Rates Over Time
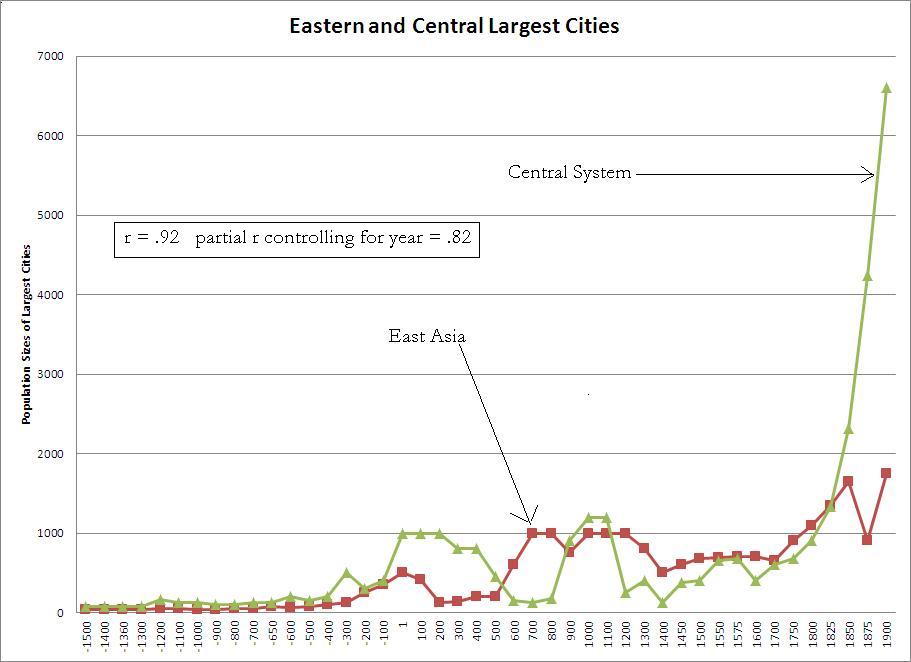
Figure A1: Largest cities in the
Central and East Asian PMNs
Empire-City Comparisons
Figures from the paper
Table A1: List of Sweeps
and comparison of two counting methods
Two-Method Comparison
— CITIES
Mesopotamia
-3700
~-1450 (2250 yrs)
Upsweeps
|
Year |
Pop. Size (k) |
City name |
Comp w largest |
Comp w average |
|
-3600 |
15 |
Tell Brak |
1 (275%) |
1 (275%) |
|
-3300 |
40 |
Uruk |
1 (700%) |
1 (321%) |
|
-2800 |
80 |
Uruk |
1 (100%) |
1 (307%) |
|
-2700 |
100 |
Ur |
1 (100%) |
1 (76%) |
|
Sweeps total |
4 |
4 |
||
|
Ups total |
7 |
7 |
Downsweeps
|
Year |
Pop. Size (k) |
City name |
Comp w smallest |
Comp w average |
|
--- |
--- |
--- |
--- |
--- |
|
Sweeps total |
--- |
--- |
0 |
0 |
|
downs total |
--- |
--- |
7 |
7 |
Egypt
-2500~-1500
(1000 yrs)
Upsweeps
|
Year |
Pop. Size (k) |
City name |
Comp w largest |
Comp w average |
|
-2250 |
35 |
Memphis |
1 (3400%) |
--- |
|
-2000 |
60 |
Memphis |
1 (71%) |
1 (71%) |
|
-1600 |
75 |
Avaris |
---- |
1 (58%) |
|
Sweeps total |
--- |
--- |
1 |
2 |
|
Ups total |
--- |
--- |
3 |
3 |
Downsweeps
|
Year |
Pop. Size (k) |
City name |
Comp w smallest |
Comp w average |
|
-1700 |
20 |
Avaris |
1 (33%) |
1 (-33%) |
|
Sweeps total |
0 |
0 |
||
|
Downs total |
2 |
2 |
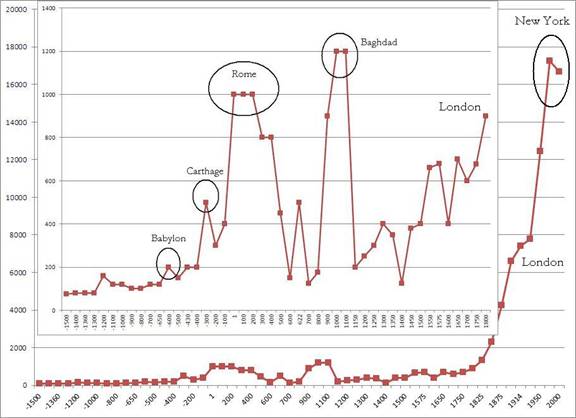
Central
PMN
1500
~2000 (3500 yrs)
Upsweeps
|
Year |
Pop. Size (k) |
City name |
Comp w largest |
Comp w average |
|
-1200 |
160 |
Pi-Ramsis |
1 (113%) |
--- (---) |
|
-600 |
200 |
Babylon |
--- (25%) |
1 (43%) |
|
-300 |
500 |
Carthage |
1 (150%) |
1 (213%) |
|
1 |
1000 |
Rome |
1 (100%) |
1 (266%) |
|
1000 |
1200 |
Baghdad |
--- (20%) |
1 (57%) |
|
1970 |
17252 |
New York |
1 (2365%) |
1 (2808%) |
|
Sweeps total |
--- |
--- |
3 |
5 |
|
Ups total |
--- |
--- |
12 |
12 |
Downsweeps
|
Year |
Pop. Size (k) |
City name |
Comp w largest |
Comp w average |
|
600 |
150 |
Constantinople |
--- (0%) |
1 (-64%) |
|
700 |
125 |
Constantinople |
--- (-17%) |
1 (-70%) |
|
1150 |
200 |
Merv / Constantinople |
--- (60%) |
1 (-44%) |
|
Sweeps total |
--- |
--- |
0 |
3 |
|
Downs total |
--- |
--- |
12 |
12 |
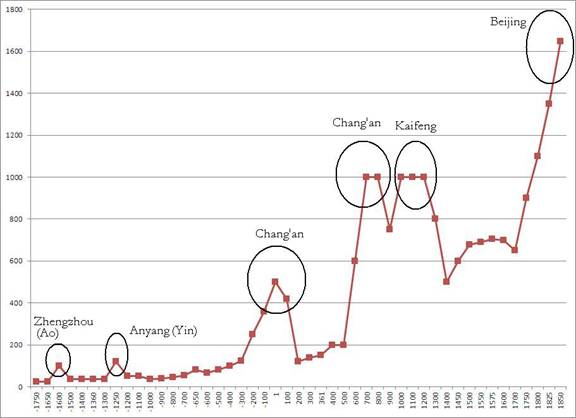
East
Asia
-1750 ~1830
(3580 yrs)
Upsweeps
|
Year |
Pop. Size (k) |
City name |
Comp w largest |
Comp w average |
|
-1600 |
100 |
Zhengzhou |
1 (614%) |
1 (614%) |
|
-1250 |
120 |
Anyang/Yinxu |
--- (20%) |
1 (111%) |
|
1 |
500 |
Chang'an |
1 (317%) |
1 (500%) |
|
700 |
1000 |
Chang'an |
1 (100%) |
1 (367%) |
|
1000 |
1000 |
Kaifeng |
--- (0%) |
1 (90%) |
|
Sweeps total |
--- |
--- |
3 |
5 |
|
Ups total |
--- |
--- |
9 |
9 |
Downsweeps
|
Year |
Pop. Size (k) |
City name |
Comp w largest |
Comp w average |
|
--- |
--- |
--- |
--- |
--- |
|
Sweeps total |
--- |
--- |
0 |
0 |
|
Downs total |
--- |
--- |
8 |
8 |
South
Asia
-500
~1000 (1500 yrs)
Upsweeps
|
Year |
Pop. Size (k) |
City name |
Comp w largest |
Comp w average |
|
-300 |
400 |
Pataliputra/Vaishali |
1 (900%) |
1 (900%) |
|
1500 |
500 |
Vijayanagar |
--- |
--- |
|
1700 |
1000 |
Ayutthaya |
--- |
--- |
|
Sweeps total |
--- |
--- |
1 |
1 |
|
Ups total |
--- |
--- |
5 |
5 |
Downsweeps
|
Year |
Pop. Size (k) |
City name |
Comp w largest |
Comp w average |
|
--- |
--- |
--- |
--- |
--- |
|
Sweeps total |
--- |
--- |
0 |
0 |
|
Downs total |
--- |
--- |
4 |
4 |
Table: A2: Cycles and
Sweep Rates Over Time
Changing
Rates of Urban Swings and Sweeps?:
The number of
cycles and upsweeps in the five intervals in five regions
Mesopotamia
-3700 ~-1450
(2250 yrs)
|
|
Interval 450
years |
# of cycle |
# of upsweeps |
# of down
sweeps |
|
phase1 |
- 3700 ~ -3250 |
2 |
2 |
0 |
|
phase2 |
-3249 ~ - 2800 |
1 |
1 |
0 |
|
phase3 |
-2799 ~ - 2350 |
0.5 |
0 |
0 |
|
phase4 |
-2349 ~ - 1850 |
1 |
1 |
0 |
|
phase5 |
-1849 ~ -1400 |
1.5 |
0 |
0 |
Total
from our other count table-- FYI
Upsweeps
4; ups 7
Downsweeps 0; downs 6
Egypt
-2500~-1500
(1000 yrs)
|
|
interval 200
years |
# of cycle |
# of upsweeps |
# of down
sweeps |
|
phase1 |
- 2500 ~ -2300 |
0.5 |
0 |
0 |
|
phase2 |
-2299 ~ - 2100 |
0.5 |
0 |
0 |
|
phase3 |
-2099 ~ - 1900 |
0.5 |
1 |
0 |
|
phase4 |
-1899 ~ - 1700 |
0.5 |
0 |
1 |
|
phase5 |
-1699 ~ -1500 |
1 |
1 |
0 |
Total
from our other count table-- FYI
Upsweeps
2; ups 3
Downsweeps 1; downs 2
Central PMN
-1500~
2000 (3500 yrs)
|
|
interval 700
years |
# of cycle |
# of upsweeps |
# of down
sweeps |
|
phase1 |
-1500 ~ -800 |
2.5 |
0 |
0 |
|
phase2 |
-799 ~ -100 |
2 |
2 |
0 |
|
phase3 |
-99 ~ 600 |
1.5 |
2 |
0 |
|
phase4 |
601 ~ 1300 |
3 |
1 |
3 |
|
phase5 |
1301 ~ 2000 |
3 |
1 |
0 |
Total
from our other count table-- FYI
Upsweeps
6; ups 12
Downsweeps 3; downs 12
East Asia
-1750
~1850 (3600 yrs)
|
|
interval 720
years |
# of cycle |
# of upsweeps |
# of down
sweeps |
|
phase1 |
-1750 ~ -1030 |
3 |
2 |
1 |
|
phase2 |
-1029 ~ -310 |
1.5 |
0 |
0 |
|
phase3 |
-309 ~ 410 |
1 |
1 |
0 |
|
phase4 |
411 ~ 1130 |
1 |
2 |
0 |
|
phase5 |
1131 ~ 1850 |
2.5 |
1 |
0 |
Total
from our other count table ---FYI
Upsweeps
6; ups 9
Downsweeps 1; downs 8
South Asia
-500 ~1000 (1500 yrs)
|
|
interval 300
years |
# of cycle |
# of upsweeps |
# of down
sweeps |
|
phase1 |
-500 ~ -200 |
1 |
1 |
0 |
|
phase2 |
-199 ~ 100 |
0.5 |
0 |
0 |
|
phase3 |
101 ~ 400 |
0.5 |
0 |
0 |
|
phase4 |
401 ~ 700 |
1.5 |
0 |
0 |
|
phase5 |
704 ~ 1000 |
1.5 |
0 |
0 |
Table
A2: Frequency of Cycles and Upsweeps in subperiods
for each Regional PMN
Table A2 divides the total period for each PMN into five equally-sized subperiods (phases 1-5) and counts the number of cycles, upsweeps and downsweeps for each subperiod to see if there is an acceleration of cycles or sweeps over the period of study. This exercise shows no consistent trends regarding the frequency of sweeps or cycles.
Figure A2: Largest cities in the Central and East Asian PMNs
Comparison between city and empire (polity) upsweeps
v. 7/12/2012
The following tables compare if there is a
relationship between city upsweep and empire (polity) upsweep.
This is examining whether the upsweep of city size is
due to the rise of a very large empire.
Mesopotamia
Empires upsweep
|
Year |
size |
Polity name |
|
-3500 |
0.0014 |
Susa (Shush) |
|
-2400 |
0.05 |
Lagash |
|
-2250 |
0.8 |
Akkadia |
|
-1450 |
0.3 |
Mitanni |
Cities upsweeps
|
Year |
Pop. Size (k) |
City name |
Relationship with Empire upsweep of the same period |
|
|
-3600 |
15 |
Tell Brak |
unknown |
city upsweep might precede empire upsweep (polity
size unknown) |
|
-3300 |
40 |
Uruk |
unknown |
city upsweep might precede empire upsweep (polity
size unknown) |
|
-2800 |
80 |
Uruk |
unknown |
although capital of Sumer, annexed to Akkadian empire
rise. city upsweep might precede empire upsweep |
|
-2700 |
100 |
Ur |
unknown |
urban upsweep might be related to Akkadian empire rise |
Egypt
Empire upsweeps
|
Year |
Size |
Polity name |
|
-2400 |
0.4 |
5th Dynasty |
|
-1850 |
0.5 |
12th Dynasty |
|
-1650 |
0.65 |
Hyksos |
City upsweeps
|
Year |
Pop. Size (k) |
City name |
Relationship with Empire upsweep of the same period |
|
|
-2250 |
35 |
Memphis |
Yes |
corresponding urban and polity (Egypt) upsweep |
|
-2000 |
60 |
Memphis |
Yes |
corresponding urban and polity (Egypt) upsweep |
|
-1600 |
75 |
Avaris |
Yes |
rise as the capital of Hyksos |
Central PMN
Empire upsweep
|
Year |
Size |
Polity name |
|
-1450 |
1 |
18th Dynasty |
|
-670 |
1.4 |
Assyria |
|
-480 |
5.4 |
Achaemenid Persia |
|
117 |
5 |
Rome |
|
750 |
11.1 |
Abbasids |
|
1294 |
29.4 |
Mongol/Yuan |
|
1936 |
34.5 |
Britain |
City upsweeps
|
Year |
Pop. Size (k) |
City name |
Relationship with Empire upsweep of the same period |
|
|
-600 |
200 |
Babylon |
No |
rise with the Neo-Babylonian Empire (612- 539 BCE) |
|
-300 |
500 |
Carthage |
No |
pop. growth with trade entrepreneurship |
|
1 |
1000 |
Rome |
Yes |
urban upsweep preceded empire (Rome) upsweep |
|
1000 |
1200 |
Baghdad |
Yes |
rise as the capital of the Abbasid Caliphate |
|
1970 |
17252 |
New York |
No |
rise was due to the formation of a continental hegemon |
East Asia
Empire upsweeps
|
Year |
Size |
Polity name |
|
-1800 |
0.45 |
Xia (Hsia) |
|
-1050 |
1.25 |
Western Zhou (Chou) |
|
-176 |
4.03 |
Xiongnu (Hsiung-nu) |
|
-50 |
6 |
Western Han |
|
100 |
6.5 |
Eastern (Later) Han |
|
624 |
1.5 |
E. Turks |
|
660 |
4.9 |
Tang (T'ang) |
|
1294 |
29.4 |
Mongol/Yuan |
|
1790 |
14.7 |
Qing |
City upsweeps
|
Year |
Pop. Size (k) |
City name |
Relationship with Empire upsweep of the same period |
|
|
-1600 |
100 |
Zhengzhou |
unknown/yes |
corresponding to the rise of Shang dynasty |
|
-1250 |
120 |
Anyang/Yinxu |
unknown/yes |
corresponding to the rise of Shang dynasty |
|
1 |
500 |
Chang'an |
yes |
contributed to the rise of Han dynasty capital of Western Han (206 BCE ~ 9 CE) |
|
700 |
1000 |
Chang'an |
yes |
contributed to the rise of Tang dynasty capital of Tang (618-904CE) |
|
1000 |
1000 |
Kaifeng |
No |
rose to form the capital of Song dynasty (960-1279CE) |
South Asia
Empire upsweep
|
Year |
Size |
Polity name |
|
-260 |
3.72 |
Mauryan |
City upsweeps
|
Year |
Pop. Size (k) |
City name |
Relationship with Empire upsweep of the same period |
|
|
-300 |
400 |
Pataliputra/Vaishali |
yes |
rose as the capital of Maruyan empire |
Figures
from the paper:
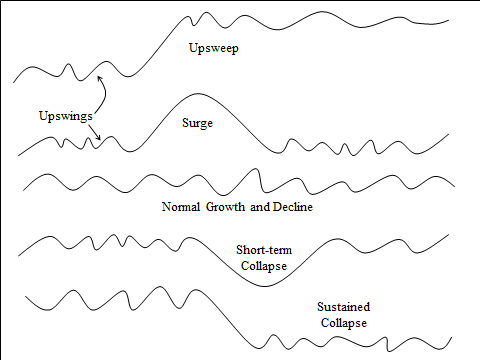
Fig. 1. Types of Medium-term Scale Change in the
Largest Settlement in an Interacting Set of Polities
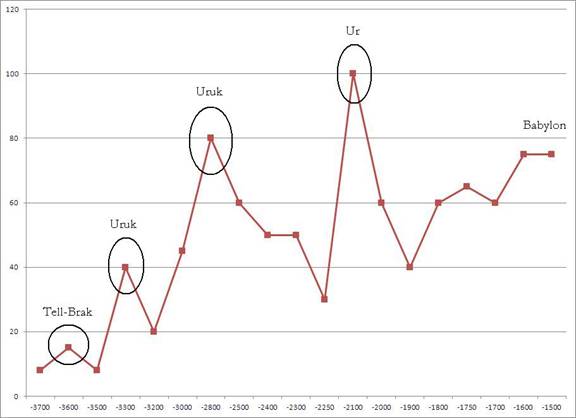
Figure 2: Largest cities in Mesopotamia, 3700 BCE-1450
BCE (population in thousands)
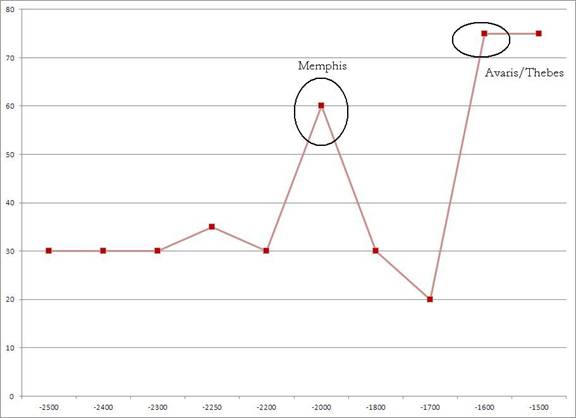
Figure 3: Egyptian Largest Cities 2500 BCE-1500 BCE
Figure
4: Central System Largest Cities, 1500
BCE- 2000 CE
Figure
5: Largest cities in East Asia
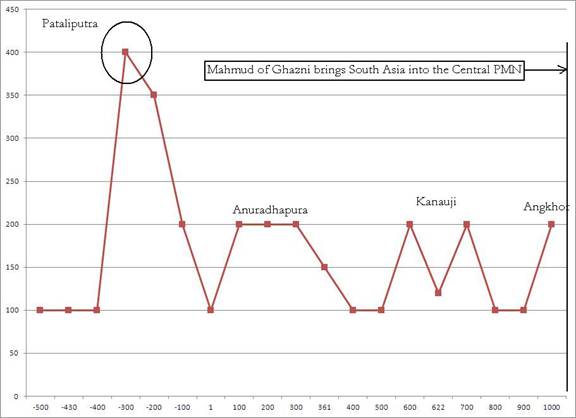
Figure
6: South Asian Largest Cities, 500 BCE-1100 CE